Immigrants from West Indies vs Basque 11th Grade
COMPARE
Immigrants from West Indies
Basque
11th Grade
11th Grade Comparison
Immigrants from West Indies
Basques
90.4%
11TH GRADE
0.0/ 100
METRIC RATING
286th/ 347
METRIC RANK
93.2%
11TH GRADE
95.2/ 100
METRIC RATING
126th/ 347
METRIC RANK
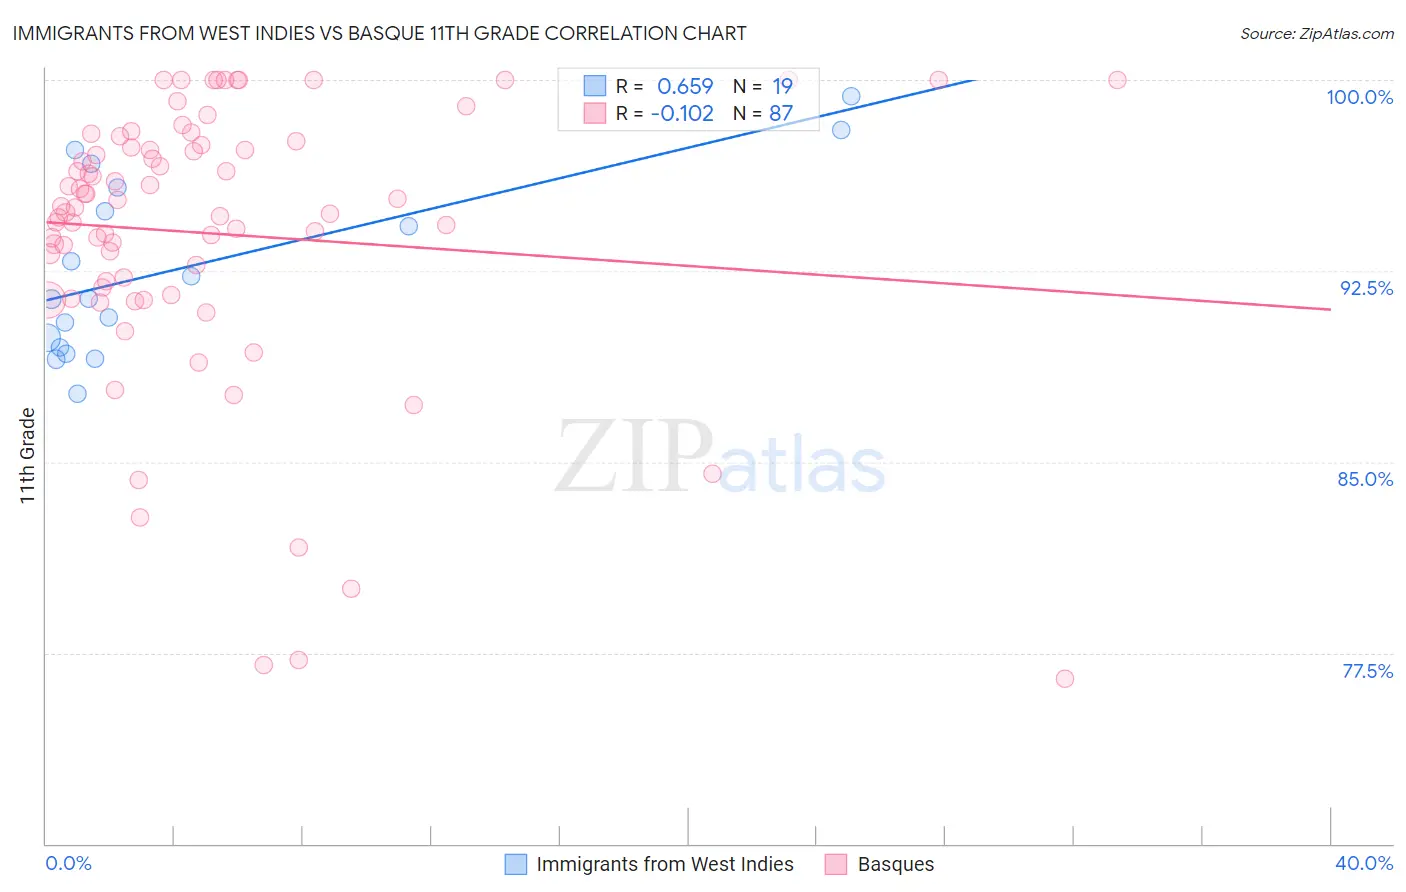
Immigrants from West Indies vs Basque 11th Grade Correlation Chart
The statistical analysis conducted on geographies consisting of 72,457,514 people shows a significant positive correlation between the proportion of Immigrants from West Indies and percentage of population with at least 11th grade education in the United States with a correlation coefficient (R) of 0.659 and weighted average of 90.4%. Similarly, the statistical analysis conducted on geographies consisting of 165,777,136 people shows a poor negative correlation between the proportion of Basques and percentage of population with at least 11th grade education in the United States with a correlation coefficient (R) of -0.102 and weighted average of 93.2%, a difference of 3.1%.
11th Grade Correlation Summary
| Measurement | Immigrants from West Indies | Basque |
| Minimum | 87.7% | 76.5% |
| Maximum | 99.4% | 100.0% |
| Range | 11.7% | 23.5% |
| Mean | 92.6% | 94.0% |
| Median | 91.4% | 95.0% |
| Interquartile 25% (IQ1) | 89.5% | 91.9% |
| Interquartile 75% (IQ3) | 95.8% | 97.5% |
| Interquartile Range (IQR) | 6.3% | 5.6% |
| Standard Deviation (Sample) | 3.5% | 5.4% |
| Standard Deviation (Population) | 3.4% | 5.4% |
Similar Demographics by 11th Grade
Demographics Similar to Immigrants from West Indies by 11th Grade
In terms of 11th grade, the demographic groups most similar to Immigrants from West Indies are Apache (90.4%, a difference of 0.010%), Pennsylvania German (90.3%, a difference of 0.030%), Immigrants from Burma/Myanmar (90.4%, a difference of 0.050%), British West Indian (90.3%, a difference of 0.050%), and Indonesian (90.3%, a difference of 0.080%).
| Demographics | Rating | Rank | 11th Grade |
| Barbadians | 0.0 /100 | #279 | Tragic 90.8% |
| Sri Lankans | 0.0 /100 | #280 | Tragic 90.7% |
| Dutch West Indians | 0.0 /100 | #281 | Tragic 90.7% |
| Immigrants | St. Vincent and the Grenadines | 0.0 /100 | #282 | Tragic 90.7% |
| Immigrants | Barbados | 0.0 /100 | #283 | Tragic 90.7% |
| Immigrants | Laos | 0.0 /100 | #284 | Tragic 90.5% |
| Immigrants | Burma/Myanmar | 0.0 /100 | #285 | Tragic 90.4% |
| Immigrants | West Indies | 0.0 /100 | #286 | Tragic 90.4% |
| Apache | 0.0 /100 | #287 | Tragic 90.4% |
| Pennsylvania Germans | 0.0 /100 | #288 | Tragic 90.3% |
| British West Indians | 0.0 /100 | #289 | Tragic 90.3% |
| Indonesians | 0.0 /100 | #290 | Tragic 90.3% |
| Haitians | 0.0 /100 | #291 | Tragic 90.3% |
| Cubans | 0.0 /100 | #292 | Tragic 90.2% |
| Natives/Alaskans | 0.0 /100 | #293 | Tragic 90.2% |
Demographics Similar to Basques by 11th Grade
In terms of 11th grade, the demographic groups most similar to Basques are Immigrants from Sri Lanka (93.2%, a difference of 0.020%), Immigrants from Greece (93.2%, a difference of 0.040%), Immigrants from Eastern Europe (93.2%, a difference of 0.040%), German Russian (93.3%, a difference of 0.070%), and Immigrants from Belarus (93.3%, a difference of 0.070%).
| Demographics | Rating | Rank | 11th Grade |
| Israelis | 97.0 /100 | #119 | Exceptional 93.3% |
| Immigrants | Russia | 96.6 /100 | #120 | Exceptional 93.3% |
| German Russians | 96.4 /100 | #121 | Exceptional 93.3% |
| Immigrants | Belarus | 96.3 /100 | #122 | Exceptional 93.3% |
| Immigrants | Greece | 95.9 /100 | #123 | Exceptional 93.2% |
| Immigrants | Eastern Europe | 95.9 /100 | #124 | Exceptional 93.2% |
| Immigrants | Sri Lanka | 95.6 /100 | #125 | Exceptional 93.2% |
| Basques | 95.2 /100 | #126 | Exceptional 93.2% |
| Immigrants | Kazakhstan | 92.4 /100 | #127 | Exceptional 93.1% |
| Immigrants | Jordan | 92.4 /100 | #128 | Exceptional 93.1% |
| Immigrants | Ukraine | 89.8 /100 | #129 | Excellent 93.0% |
| Albanians | 89.5 /100 | #130 | Excellent 93.0% |
| Egyptians | 89.5 /100 | #131 | Excellent 93.0% |
| Immigrants | Bosnia and Herzegovina | 89.0 /100 | #132 | Excellent 93.0% |
| Mongolians | 87.6 /100 | #133 | Excellent 93.0% |