Welsh vs Basque Unemployment Among Ages 20 to 24 years
COMPARE
Welsh
Basque
Unemployment Among Ages 20 to 24 years
Unemployment Among Ages 20 to 24 years Comparison
Welsh
Basques
9.8%
UNEMPLOYMENT AMONG AGES 20 TO 24 YEARS
99.3/ 100
METRIC RATING
65th/ 347
METRIC RANK
10.1%
UNEMPLOYMENT AMONG AGES 20 TO 24 YEARS
89.8/ 100
METRIC RATING
116th/ 347
METRIC RANK
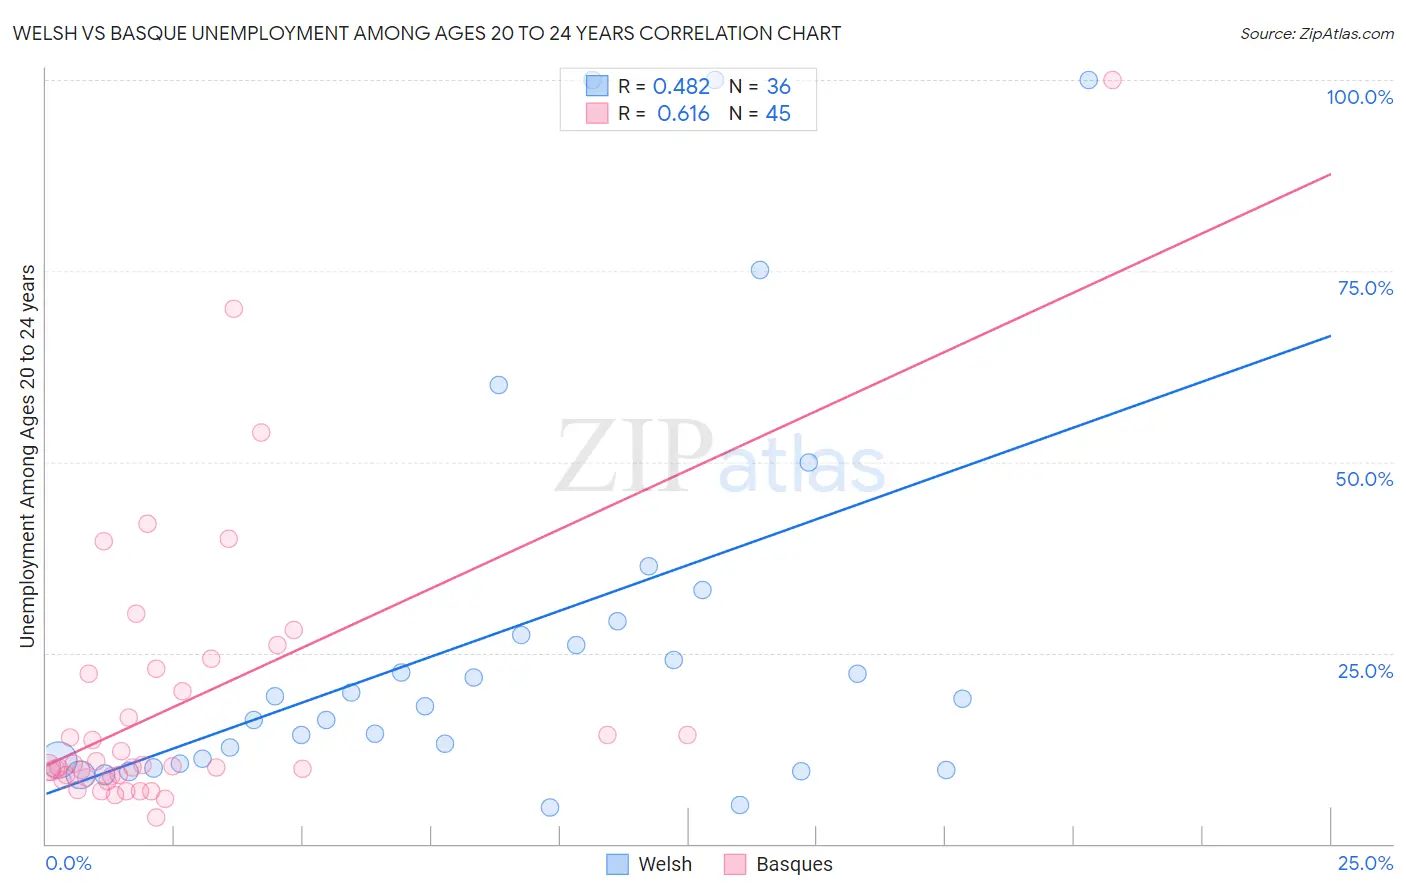
Welsh vs Basque Unemployment Among Ages 20 to 24 years Correlation Chart
The statistical analysis conducted on geographies consisting of 490,778,203 people shows a moderate positive correlation between the proportion of Welsh and unemployment rate among population between the ages 20 and 24 in the United States with a correlation coefficient (R) of 0.482 and weighted average of 9.8%. Similarly, the statistical analysis conducted on geographies consisting of 163,440,672 people shows a significant positive correlation between the proportion of Basques and unemployment rate among population between the ages 20 and 24 in the United States with a correlation coefficient (R) of 0.616 and weighted average of 10.1%, a difference of 2.7%.
Unemployment Among Ages 20 to 24 years Correlation Summary
| Measurement | Welsh | Basque |
| Minimum | 4.8% | 3.5% |
| Maximum | 100.0% | 100.0% |
| Range | 95.2% | 96.5% |
| Mean | 27.5% | 18.4% |
| Median | 18.5% | 10.2% |
| Interquartile 25% (IQ1) | 10.7% | 8.7% |
| Interquartile 75% (IQ3) | 28.3% | 22.5% |
| Interquartile Range (IQR) | 17.5% | 13.8% |
| Standard Deviation (Sample) | 26.7% | 18.5% |
| Standard Deviation (Population) | 26.3% | 18.3% |
Similar Demographics by Unemployment Among Ages 20 to 24 years
Demographics Similar to Welsh by Unemployment Among Ages 20 to 24 years
In terms of unemployment among ages 20 to 24 years, the demographic groups most similar to Welsh are British (9.8%, a difference of 0.070%), Serbian (9.8%, a difference of 0.070%), Immigrants from Singapore (9.8%, a difference of 0.080%), Scottish (9.8%, a difference of 0.080%), and Malaysian (9.8%, a difference of 0.18%).
| Demographics | Rating | Rank | Unemployment Among Ages 20 to 24 years |
| Pakistanis | 99.5 /100 | #58 | Exceptional 9.8% |
| English | 99.5 /100 | #59 | Exceptional 9.8% |
| Immigrants | Kuwait | 99.5 /100 | #60 | Exceptional 9.8% |
| Malaysians | 99.5 /100 | #61 | Exceptional 9.8% |
| Immigrants | Singapore | 99.4 /100 | #62 | Exceptional 9.8% |
| British | 99.4 /100 | #63 | Exceptional 9.8% |
| Serbians | 99.4 /100 | #64 | Exceptional 9.8% |
| Welsh | 99.3 /100 | #65 | Exceptional 9.8% |
| Scottish | 99.3 /100 | #66 | Exceptional 9.8% |
| Immigrants | Bolivia | 99.2 /100 | #67 | Exceptional 9.9% |
| Mongolians | 99.1 /100 | #68 | Exceptional 9.9% |
| Bulgarians | 99.1 /100 | #69 | Exceptional 9.9% |
| Immigrants | Croatia | 99.0 /100 | #70 | Exceptional 9.9% |
| Celtics | 98.9 /100 | #71 | Exceptional 9.9% |
| Bolivians | 98.9 /100 | #72 | Exceptional 9.9% |
Demographics Similar to Basques by Unemployment Among Ages 20 to 24 years
In terms of unemployment among ages 20 to 24 years, the demographic groups most similar to Basques are Immigrants from Uruguay (10.1%, a difference of 0.010%), Immigrants from Morocco (10.1%, a difference of 0.070%), Paraguayan (10.1%, a difference of 0.11%), Ottawa (10.1%, a difference of 0.12%), and French (10.1%, a difference of 0.15%).
| Demographics | Rating | Rank | Unemployment Among Ages 20 to 24 years |
| Filipinos | 93.2 /100 | #109 | Exceptional 10.1% |
| Immigrants | Spain | 93.1 /100 | #110 | Exceptional 10.1% |
| Immigrants | Indonesia | 92.7 /100 | #111 | Exceptional 10.1% |
| Northern Europeans | 92.7 /100 | #112 | Exceptional 10.1% |
| German Russians | 92.4 /100 | #113 | Exceptional 10.1% |
| Ottawa | 90.8 /100 | #114 | Exceptional 10.1% |
| Immigrants | Morocco | 90.5 /100 | #115 | Exceptional 10.1% |
| Basques | 89.8 /100 | #116 | Excellent 10.1% |
| Immigrants | Uruguay | 89.6 /100 | #117 | Excellent 10.1% |
| Paraguayans | 88.6 /100 | #118 | Excellent 10.1% |
| French | 88.2 /100 | #119 | Excellent 10.1% |
| Immigrants | Canada | 88.2 /100 | #120 | Excellent 10.1% |
| South Africans | 87.8 /100 | #121 | Excellent 10.1% |
| Whites/Caucasians | 87.4 /100 | #122 | Excellent 10.1% |
| Immigrants | Iraq | 87.1 /100 | #123 | Excellent 10.1% |