Vietnamese vs Ugandan 12th Grade, No Diploma
COMPARE
Vietnamese
Ugandan
12th Grade, No Diploma
12th Grade, No Diploma Comparison
Vietnamese
Ugandans
87.9%
12TH GRADE, NO DIPLOMA
0.0/ 100
METRIC RATING
304th/ 347
METRIC RANK
91.5%
12TH GRADE, NO DIPLOMA
79.0/ 100
METRIC RATING
149th/ 347
METRIC RANK
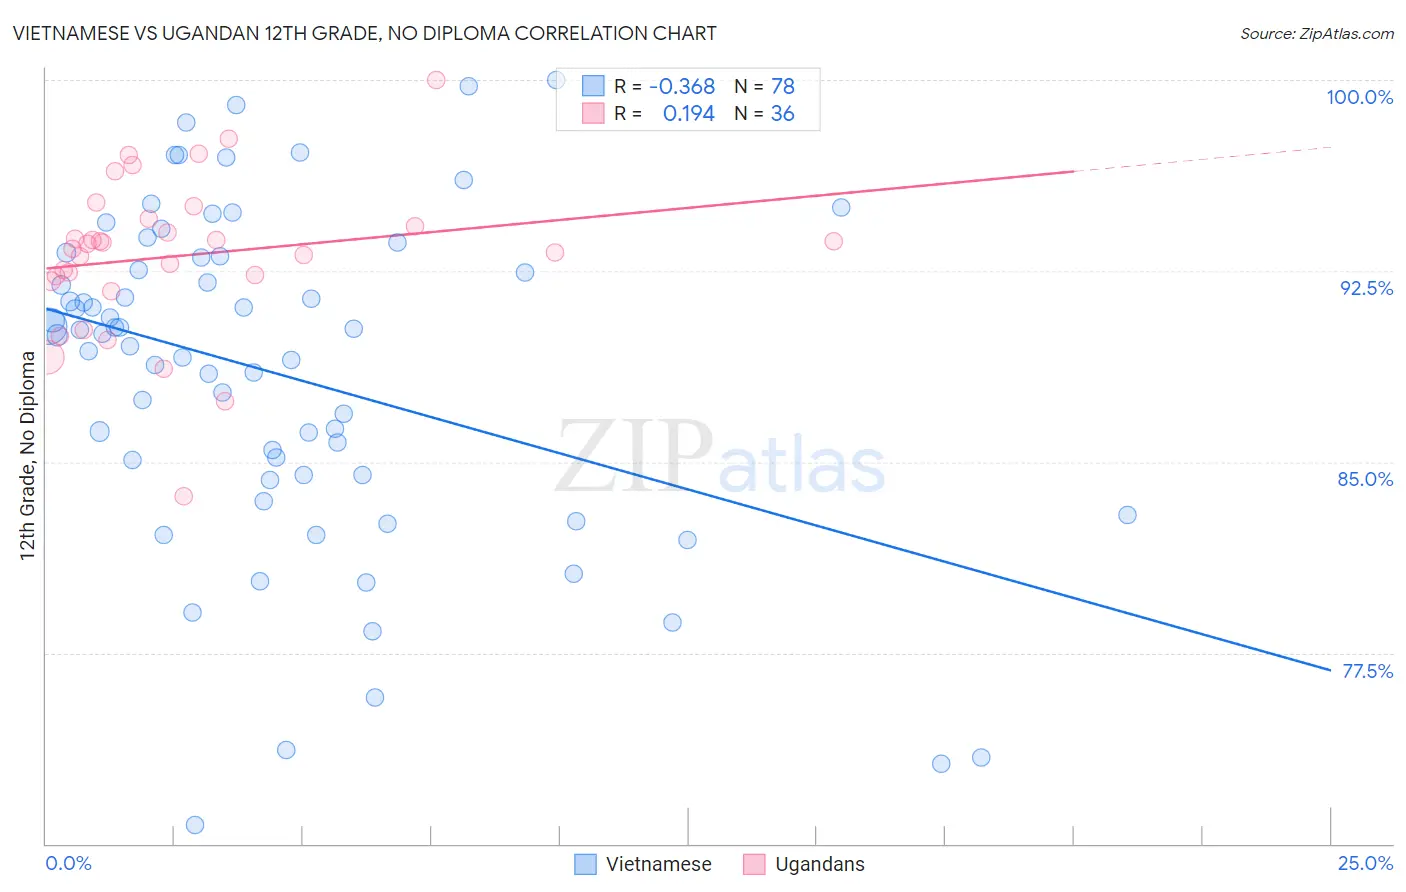
Vietnamese vs Ugandan 12th Grade, No Diploma Correlation Chart
The statistical analysis conducted on geographies consisting of 170,753,564 people shows a mild negative correlation between the proportion of Vietnamese and percentage of population with at least 12th grade (no diploma) education in the United States with a correlation coefficient (R) of -0.368 and weighted average of 87.9%. Similarly, the statistical analysis conducted on geographies consisting of 93,991,892 people shows a poor positive correlation between the proportion of Ugandans and percentage of population with at least 12th grade (no diploma) education in the United States with a correlation coefficient (R) of 0.194 and weighted average of 91.5%, a difference of 4.1%.
12th Grade, No Diploma Correlation Summary
| Measurement | Vietnamese | Ugandan |
| Minimum | 70.7% | 83.7% |
| Maximum | 100.0% | 100.0% |
| Range | 29.3% | 16.3% |
| Mean | 88.4% | 93.1% |
| Median | 90.0% | 93.5% |
| Interquartile 25% (IQ1) | 84.5% | 92.2% |
| Interquartile 75% (IQ3) | 93.0% | 94.4% |
| Interquartile Range (IQR) | 8.5% | 2.2% |
| Standard Deviation (Sample) | 6.6% | 3.1% |
| Standard Deviation (Population) | 6.5% | 3.0% |
Similar Demographics by 12th Grade, No Diploma
Demographics Similar to Vietnamese by 12th Grade, No Diploma
In terms of 12th grade, no diploma, the demographic groups most similar to Vietnamese are Immigrants from Bangladesh (88.0%, a difference of 0.060%), Ecuadorian (88.0%, a difference of 0.17%), Immigrants from Guyana (88.1%, a difference of 0.19%), Immigrants from Cambodia (88.1%, a difference of 0.19%), and Immigrants from Dominica (87.7%, a difference of 0.19%).
| Demographics | Rating | Rank | 12th Grade, No Diploma |
| Pueblo | 0.0 /100 | #297 | Tragic 88.2% |
| Immigrants | Haiti | 0.0 /100 | #298 | Tragic 88.2% |
| Nepalese | 0.0 /100 | #299 | Tragic 88.1% |
| Immigrants | Guyana | 0.0 /100 | #300 | Tragic 88.1% |
| Immigrants | Cambodia | 0.0 /100 | #301 | Tragic 88.1% |
| Ecuadorians | 0.0 /100 | #302 | Tragic 88.0% |
| Immigrants | Bangladesh | 0.0 /100 | #303 | Tragic 88.0% |
| Vietnamese | 0.0 /100 | #304 | Tragic 87.9% |
| Immigrants | Dominica | 0.0 /100 | #305 | Tragic 87.7% |
| Natives/Alaskans | 0.0 /100 | #306 | Tragic 87.7% |
| Immigrants | Portugal | 0.0 /100 | #307 | Tragic 87.6% |
| Yup'ik | 0.0 /100 | #308 | Tragic 87.6% |
| Immigrants | Armenia | 0.0 /100 | #309 | Tragic 87.6% |
| Immigrants | Cuba | 0.0 /100 | #310 | Tragic 87.5% |
| Yaqui | 0.0 /100 | #311 | Tragic 87.5% |
Demographics Similar to Ugandans by 12th Grade, No Diploma
In terms of 12th grade, no diploma, the demographic groups most similar to Ugandans are Paraguayan (91.5%, a difference of 0.0%), Chippewa (91.5%, a difference of 0.0%), Immigrants from Brazil (91.5%, a difference of 0.010%), Pakistani (91.5%, a difference of 0.010%), and Indian (Asian) (91.5%, a difference of 0.010%).
| Demographics | Rating | Rank | 12th Grade, No Diploma |
| Immigrants | Venezuela | 80.9 /100 | #142 | Excellent 91.6% |
| Immigrants | Argentina | 80.7 /100 | #143 | Excellent 91.6% |
| Immigrants | Spain | 80.1 /100 | #144 | Excellent 91.6% |
| Immigrants | Lebanon | 80.0 /100 | #145 | Excellent 91.6% |
| Immigrants | Brazil | 79.8 /100 | #146 | Good 91.5% |
| Pakistanis | 79.6 /100 | #147 | Good 91.5% |
| Indians (Asian) | 79.4 /100 | #148 | Good 91.5% |
| Ugandans | 79.0 /100 | #149 | Good 91.5% |
| Paraguayans | 78.9 /100 | #150 | Good 91.5% |
| Chippewa | 78.8 /100 | #151 | Good 91.5% |
| Kenyans | 77.4 /100 | #152 | Good 91.5% |
| Iraqis | 75.3 /100 | #153 | Good 91.5% |
| Immigrants | Kenya | 73.9 /100 | #154 | Good 91.5% |
| Immigrants | Iraq | 73.0 /100 | #155 | Good 91.4% |
| Asians | 71.9 /100 | #156 | Good 91.4% |