Mongolian vs Ugandan 12th Grade, No Diploma
COMPARE
Mongolian
Ugandan
12th Grade, No Diploma
12th Grade, No Diploma Comparison
Mongolians
Ugandans
91.8%
12TH GRADE, NO DIPLOMA
89.9/ 100
METRIC RATING
128th/ 347
METRIC RANK
91.5%
12TH GRADE, NO DIPLOMA
79.0/ 100
METRIC RATING
149th/ 347
METRIC RANK
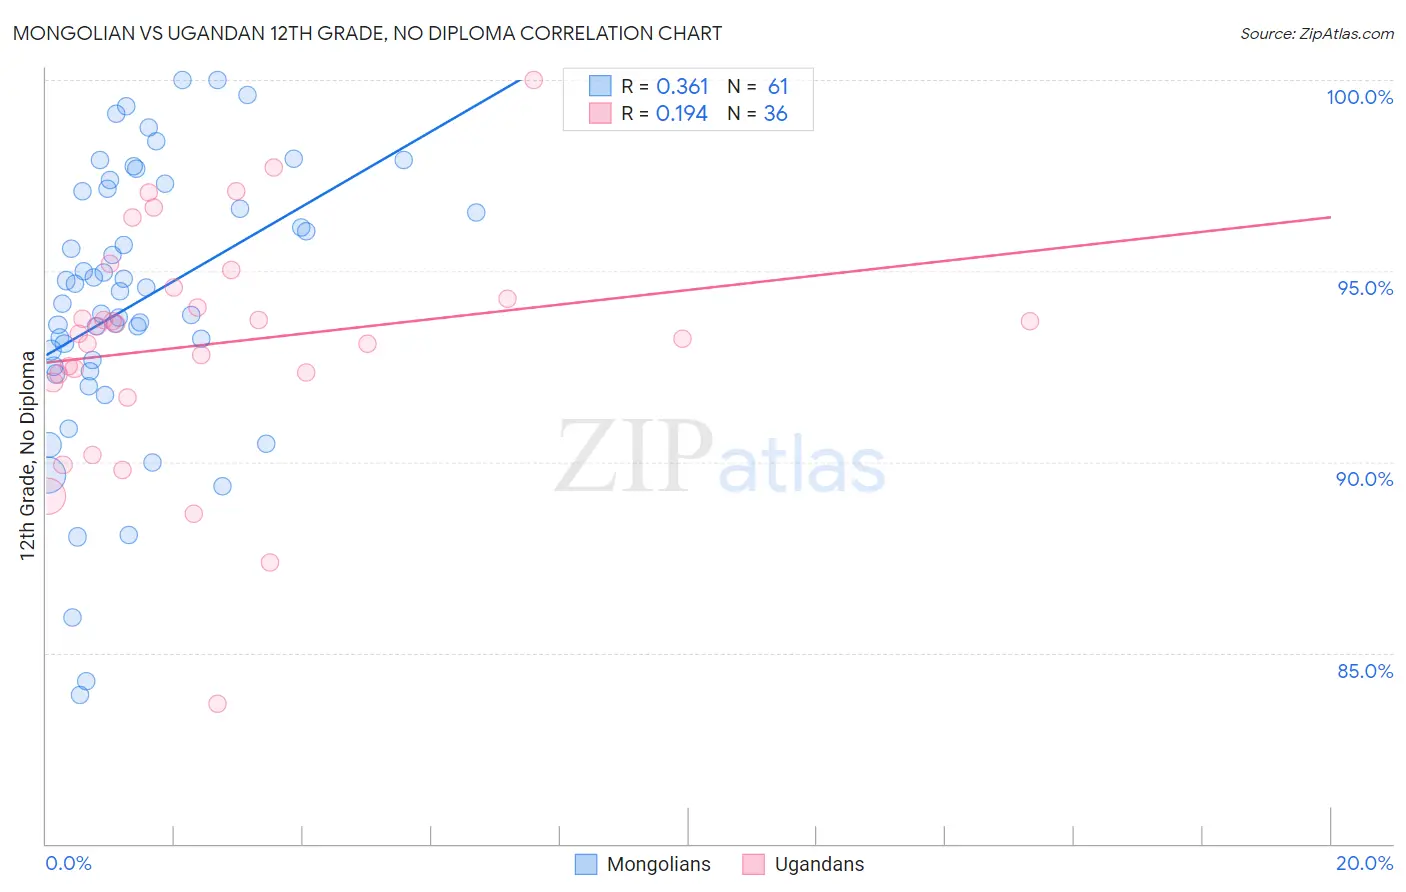
Mongolian vs Ugandan 12th Grade, No Diploma Correlation Chart
The statistical analysis conducted on geographies consisting of 140,362,004 people shows a mild positive correlation between the proportion of Mongolians and percentage of population with at least 12th grade (no diploma) education in the United States with a correlation coefficient (R) of 0.361 and weighted average of 91.8%. Similarly, the statistical analysis conducted on geographies consisting of 93,991,892 people shows a poor positive correlation between the proportion of Ugandans and percentage of population with at least 12th grade (no diploma) education in the United States with a correlation coefficient (R) of 0.194 and weighted average of 91.5%, a difference of 0.26%.
12th Grade, No Diploma Correlation Summary
| Measurement | Mongolian | Ugandan |
| Minimum | 83.9% | 83.7% |
| Maximum | 100.0% | 100.0% |
| Range | 16.1% | 16.3% |
| Mean | 94.2% | 93.1% |
| Median | 94.5% | 93.5% |
| Interquartile 25% (IQ1) | 92.4% | 92.2% |
| Interquartile 75% (IQ3) | 97.1% | 94.4% |
| Interquartile Range (IQR) | 4.7% | 2.2% |
| Standard Deviation (Sample) | 3.6% | 3.1% |
| Standard Deviation (Population) | 3.6% | 3.0% |
Similar Demographics by 12th Grade, No Diploma
Demographics Similar to Mongolians by 12th Grade, No Diploma
In terms of 12th grade, no diploma, the demographic groups most similar to Mongolians are German Russian (91.8%, a difference of 0.010%), Assyrian/Chaldean/Syriac (91.8%, a difference of 0.010%), Albanian (91.8%, a difference of 0.020%), Immigrants from Eastern Asia (91.8%, a difference of 0.020%), and Immigrants from Jordan (91.8%, a difference of 0.040%).
| Demographics | Rating | Rank | 12th Grade, No Diploma |
| Menominee | 93.5 /100 | #121 | Exceptional 91.9% |
| Ottawa | 93.1 /100 | #122 | Exceptional 91.9% |
| Egyptians | 92.5 /100 | #123 | Exceptional 91.9% |
| Immigrants | Ukraine | 91.6 /100 | #124 | Exceptional 91.8% |
| Whites/Caucasians | 91.6 /100 | #125 | Exceptional 91.8% |
| Basques | 91.3 /100 | #126 | Exceptional 91.8% |
| Immigrants | Jordan | 91.0 /100 | #127 | Exceptional 91.8% |
| Mongolians | 89.9 /100 | #128 | Excellent 91.8% |
| German Russians | 89.8 /100 | #129 | Excellent 91.8% |
| Assyrians/Chaldeans/Syriacs | 89.6 /100 | #130 | Excellent 91.8% |
| Albanians | 89.3 /100 | #131 | Excellent 91.8% |
| Immigrants | Eastern Asia | 89.3 /100 | #132 | Excellent 91.8% |
| Immigrants | Italy | 88.3 /100 | #133 | Excellent 91.7% |
| Venezuelans | 88.2 /100 | #134 | Excellent 91.7% |
| Immigrants | Bosnia and Herzegovina | 87.3 /100 | #135 | Excellent 91.7% |
Demographics Similar to Ugandans by 12th Grade, No Diploma
In terms of 12th grade, no diploma, the demographic groups most similar to Ugandans are Paraguayan (91.5%, a difference of 0.0%), Chippewa (91.5%, a difference of 0.0%), Immigrants from Brazil (91.5%, a difference of 0.010%), Pakistani (91.5%, a difference of 0.010%), and Indian (Asian) (91.5%, a difference of 0.010%).
| Demographics | Rating | Rank | 12th Grade, No Diploma |
| Immigrants | Venezuela | 80.9 /100 | #142 | Excellent 91.6% |
| Immigrants | Argentina | 80.7 /100 | #143 | Excellent 91.6% |
| Immigrants | Spain | 80.1 /100 | #144 | Excellent 91.6% |
| Immigrants | Lebanon | 80.0 /100 | #145 | Excellent 91.6% |
| Immigrants | Brazil | 79.8 /100 | #146 | Good 91.5% |
| Pakistanis | 79.6 /100 | #147 | Good 91.5% |
| Indians (Asian) | 79.4 /100 | #148 | Good 91.5% |
| Ugandans | 79.0 /100 | #149 | Good 91.5% |
| Paraguayans | 78.9 /100 | #150 | Good 91.5% |
| Chippewa | 78.8 /100 | #151 | Good 91.5% |
| Kenyans | 77.4 /100 | #152 | Good 91.5% |
| Iraqis | 75.3 /100 | #153 | Good 91.5% |
| Immigrants | Kenya | 73.9 /100 | #154 | Good 91.5% |
| Immigrants | Iraq | 73.0 /100 | #155 | Good 91.4% |
| Asians | 71.9 /100 | #156 | Good 91.4% |