Vietnamese vs Icelander 12th Grade, No Diploma
COMPARE
Vietnamese
Icelander
12th Grade, No Diploma
12th Grade, No Diploma Comparison
Vietnamese
Icelanders
87.9%
12TH GRADE, NO DIPLOMA
0.0/ 100
METRIC RATING
304th/ 347
METRIC RANK
92.3%
12TH GRADE, NO DIPLOMA
98.5/ 100
METRIC RATING
96th/ 347
METRIC RANK
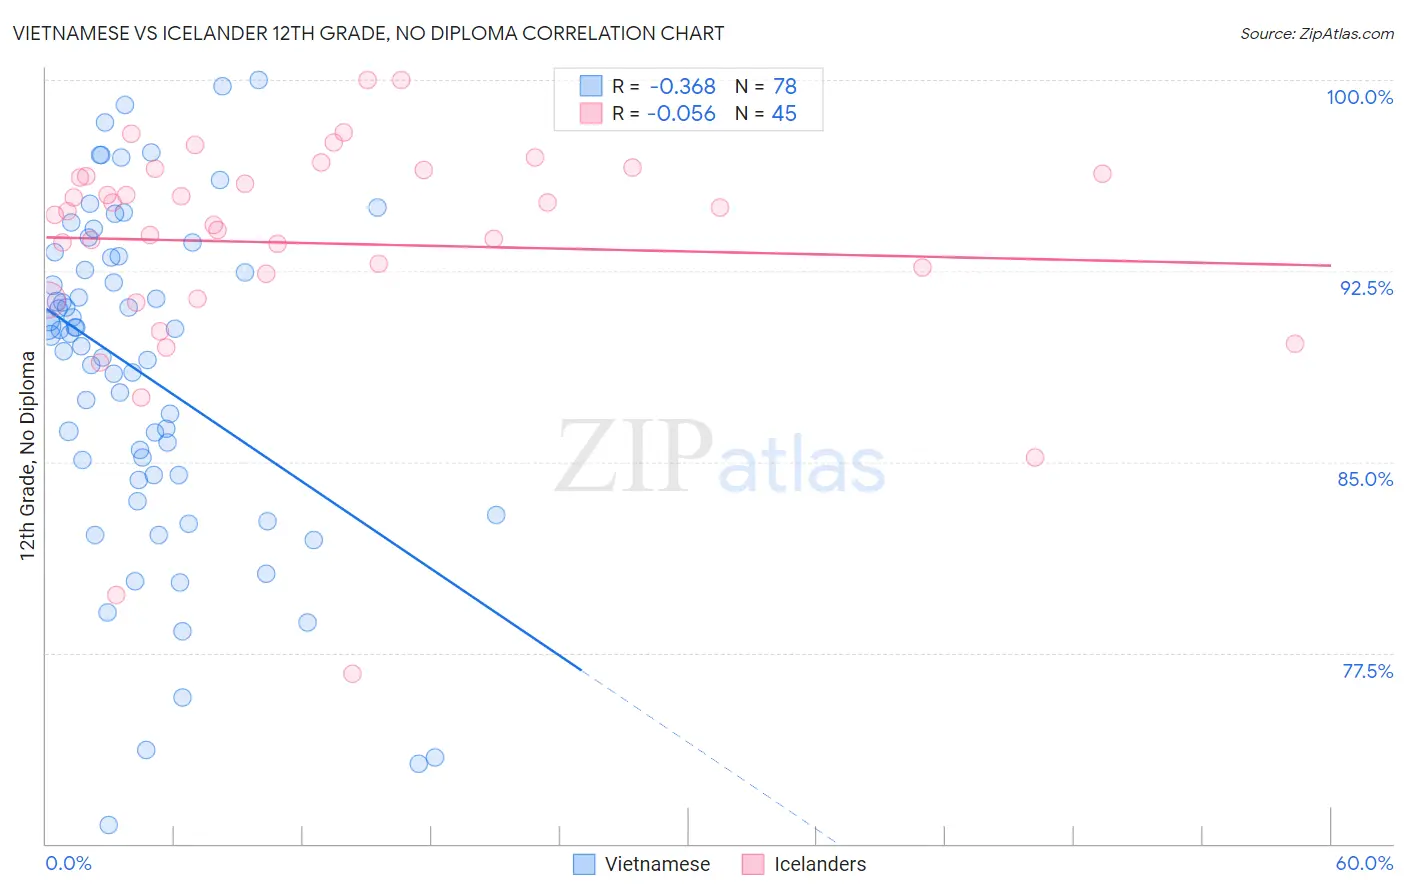
Vietnamese vs Icelander 12th Grade, No Diploma Correlation Chart
The statistical analysis conducted on geographies consisting of 170,753,564 people shows a mild negative correlation between the proportion of Vietnamese and percentage of population with at least 12th grade (no diploma) education in the United States with a correlation coefficient (R) of -0.368 and weighted average of 87.9%. Similarly, the statistical analysis conducted on geographies consisting of 159,668,816 people shows a slight negative correlation between the proportion of Icelanders and percentage of population with at least 12th grade (no diploma) education in the United States with a correlation coefficient (R) of -0.056 and weighted average of 92.3%, a difference of 5.0%.
12th Grade, No Diploma Correlation Summary
| Measurement | Vietnamese | Icelander |
| Minimum | 70.7% | 76.7% |
| Maximum | 100.0% | 100.0% |
| Range | 29.3% | 23.3% |
| Mean | 88.4% | 93.6% |
| Median | 90.0% | 94.9% |
| Interquartile 25% (IQ1) | 84.5% | 91.9% |
| Interquartile 75% (IQ3) | 93.0% | 96.4% |
| Interquartile Range (IQR) | 8.5% | 4.5% |
| Standard Deviation (Sample) | 6.6% | 4.6% |
| Standard Deviation (Population) | 6.5% | 4.5% |
Similar Demographics by 12th Grade, No Diploma
Demographics Similar to Vietnamese by 12th Grade, No Diploma
In terms of 12th grade, no diploma, the demographic groups most similar to Vietnamese are Immigrants from Bangladesh (88.0%, a difference of 0.060%), Ecuadorian (88.0%, a difference of 0.17%), Immigrants from Guyana (88.1%, a difference of 0.19%), Immigrants from Cambodia (88.1%, a difference of 0.19%), and Immigrants from Dominica (87.7%, a difference of 0.19%).
| Demographics | Rating | Rank | 12th Grade, No Diploma |
| Pueblo | 0.0 /100 | #297 | Tragic 88.2% |
| Immigrants | Haiti | 0.0 /100 | #298 | Tragic 88.2% |
| Nepalese | 0.0 /100 | #299 | Tragic 88.1% |
| Immigrants | Guyana | 0.0 /100 | #300 | Tragic 88.1% |
| Immigrants | Cambodia | 0.0 /100 | #301 | Tragic 88.1% |
| Ecuadorians | 0.0 /100 | #302 | Tragic 88.0% |
| Immigrants | Bangladesh | 0.0 /100 | #303 | Tragic 88.0% |
| Vietnamese | 0.0 /100 | #304 | Tragic 87.9% |
| Immigrants | Dominica | 0.0 /100 | #305 | Tragic 87.7% |
| Natives/Alaskans | 0.0 /100 | #306 | Tragic 87.7% |
| Immigrants | Portugal | 0.0 /100 | #307 | Tragic 87.6% |
| Yup'ik | 0.0 /100 | #308 | Tragic 87.6% |
| Immigrants | Armenia | 0.0 /100 | #309 | Tragic 87.6% |
| Immigrants | Cuba | 0.0 /100 | #310 | Tragic 87.5% |
| Yaqui | 0.0 /100 | #311 | Tragic 87.5% |
Demographics Similar to Icelanders by 12th Grade, No Diploma
In terms of 12th grade, no diploma, the demographic groups most similar to Icelanders are Immigrants from Europe (92.3%, a difference of 0.0%), Immigrants from North Macedonia (92.3%, a difference of 0.0%), Celtic (92.3%, a difference of 0.010%), Immigrants from Kuwait (92.3%, a difference of 0.010%), and Immigrants from Romania (92.3%, a difference of 0.020%).
| Demographics | Rating | Rank | 12th Grade, No Diploma |
| Canadians | 98.7 /100 | #89 | Exceptional 92.4% |
| Immigrants | Serbia | 98.6 /100 | #90 | Exceptional 92.4% |
| South Africans | 98.6 /100 | #91 | Exceptional 92.4% |
| Immigrants | Romania | 98.5 /100 | #92 | Exceptional 92.3% |
| Immigrants | Western Europe | 98.5 /100 | #93 | Exceptional 92.3% |
| Immigrants | Europe | 98.5 /100 | #94 | Exceptional 92.3% |
| Immigrants | North Macedonia | 98.5 /100 | #95 | Exceptional 92.3% |
| Icelanders | 98.5 /100 | #96 | Exceptional 92.3% |
| Celtics | 98.4 /100 | #97 | Exceptional 92.3% |
| Immigrants | Kuwait | 98.4 /100 | #98 | Exceptional 92.3% |
| Immigrants | Korea | 98.3 /100 | #99 | Exceptional 92.3% |
| Immigrants | Croatia | 98.3 /100 | #100 | Exceptional 92.3% |
| Swiss | 98.1 /100 | #101 | Exceptional 92.3% |
| Alaskan Athabascans | 98.1 /100 | #102 | Exceptional 92.3% |
| Immigrants | Norway | 98.1 /100 | #103 | Exceptional 92.3% |