Immigrants from Malaysia vs Ugandan 12th Grade, No Diploma
COMPARE
Immigrants from Malaysia
Ugandan
12th Grade, No Diploma
12th Grade, No Diploma Comparison
Immigrants from Malaysia
Ugandans
91.3%
12TH GRADE, NO DIPLOMA
57.8/ 100
METRIC RATING
167th/ 347
METRIC RANK
91.5%
12TH GRADE, NO DIPLOMA
79.0/ 100
METRIC RATING
149th/ 347
METRIC RANK
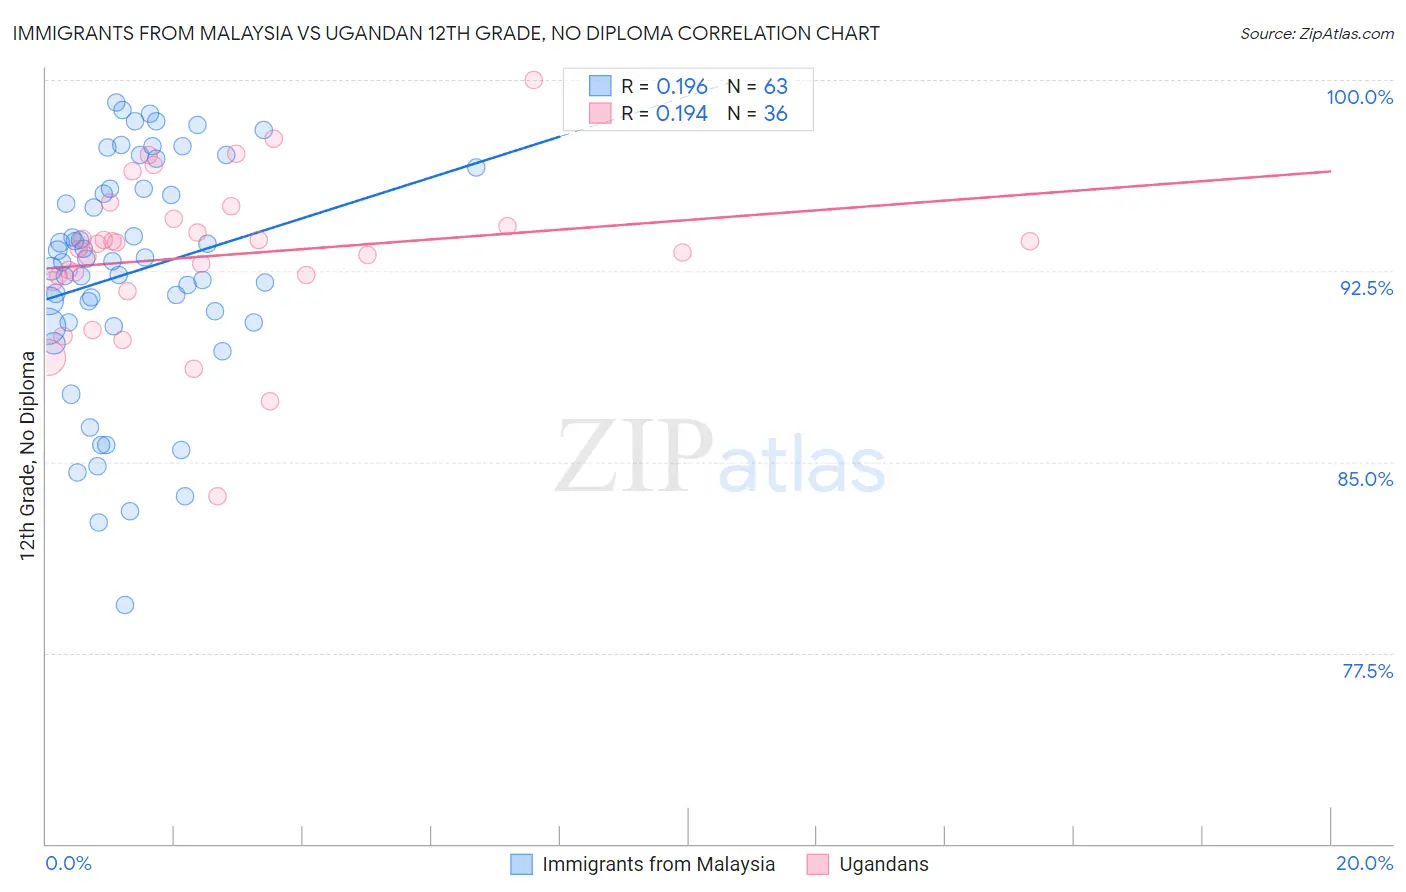
Immigrants from Malaysia vs Ugandan 12th Grade, No Diploma Correlation Chart
The statistical analysis conducted on geographies consisting of 197,973,709 people shows a poor positive correlation between the proportion of Immigrants from Malaysia and percentage of population with at least 12th grade (no diploma) education in the United States with a correlation coefficient (R) of 0.196 and weighted average of 91.3%. Similarly, the statistical analysis conducted on geographies consisting of 93,991,892 people shows a poor positive correlation between the proportion of Ugandans and percentage of population with at least 12th grade (no diploma) education in the United States with a correlation coefficient (R) of 0.194 and weighted average of 91.5%, a difference of 0.31%.
12th Grade, No Diploma Correlation Summary
| Measurement | Immigrants from Malaysia | Ugandan |
| Minimum | 79.4% | 83.7% |
| Maximum | 99.1% | 100.0% |
| Range | 19.7% | 16.3% |
| Mean | 92.4% | 93.1% |
| Median | 92.9% | 93.5% |
| Interquartile 25% (IQ1) | 90.5% | 92.2% |
| Interquartile 75% (IQ3) | 95.8% | 94.4% |
| Interquartile Range (IQR) | 5.3% | 2.2% |
| Standard Deviation (Sample) | 4.6% | 3.1% |
| Standard Deviation (Population) | 4.5% | 3.0% |
Demographics Similar to Immigrants from Malaysia and Ugandans by 12th Grade, No Diploma
In terms of 12th grade, no diploma, the demographic groups most similar to Immigrants from Malaysia are Hmong (91.3%, a difference of 0.0%), Alsatian (91.3%, a difference of 0.010%), Cree (91.2%, a difference of 0.010%), Immigrants from China (91.3%, a difference of 0.040%), and Brazilian (91.3%, a difference of 0.050%). Similarly, the demographic groups most similar to Ugandans are Paraguayan (91.5%, a difference of 0.0%), Chippewa (91.5%, a difference of 0.0%), Indian (Asian) (91.5%, a difference of 0.010%), Kenyan (91.5%, a difference of 0.030%), and Iraqi (91.5%, a difference of 0.060%).
| Demographics | Rating | Rank | 12th Grade, No Diploma |
| Indians (Asian) | 79.4 /100 | #148 | Good 91.5% |
| Ugandans | 79.0 /100 | #149 | Good 91.5% |
| Paraguayans | 78.9 /100 | #150 | Good 91.5% |
| Chippewa | 78.8 /100 | #151 | Good 91.5% |
| Kenyans | 77.4 /100 | #152 | Good 91.5% |
| Iraqis | 75.3 /100 | #153 | Good 91.5% |
| Immigrants | Kenya | 73.9 /100 | #154 | Good 91.5% |
| Immigrants | Iraq | 73.0 /100 | #155 | Good 91.4% |
| Asians | 71.9 /100 | #156 | Good 91.4% |
| Immigrants | Pakistan | 70.7 /100 | #157 | Good 91.4% |
| Immigrants | Northern Africa | 66.2 /100 | #158 | Good 91.4% |
| Laotians | 64.4 /100 | #159 | Good 91.3% |
| Immigrants | Albania | 64.1 /100 | #160 | Good 91.3% |
| Immigrants | Hong Kong | 63.8 /100 | #161 | Good 91.3% |
| Brazilians | 62.0 /100 | #162 | Good 91.3% |
| Immigrants | Asia | 61.5 /100 | #163 | Good 91.3% |
| Immigrants | China | 60.9 /100 | #164 | Good 91.3% |
| Alsatians | 58.3 /100 | #165 | Average 91.3% |
| Hmong | 58.0 /100 | #166 | Average 91.3% |
| Immigrants | Malaysia | 57.8 /100 | #167 | Average 91.3% |
| Cree | 57.0 /100 | #168 | Average 91.2% |