Vietnamese vs Egyptian 12th Grade, No Diploma

COMPARE

Vietnamese
Race
Ancestry
AfghanAfricanAlaska NativeAlaskan AthabascanAlbanianAleutAlsatianAmericanApacheArabArapahoArgentineanArmenianAssyrian/Chaldean/SyriacAustralianAustrianBahamianBangladeshiBarbadianBasqueBelgianBelizeanBermudanBhutaneseBlackfeetBolivianBrazilianBritishBritish West IndianBulgarianBurmeseCajunCambodianCanadianCape VerdeanCarpatho RusynCelticCentral AmericanCentral American IndianCherokeeCheyenneChickasawChileanChineseChippewaChoctawColombianColvilleComancheCosta RicanCreeCreekCroatianCrowCubanCypriotCzechCzechoslovakianDanishDelawareDominicanDutchDutch West IndianEastern EuropeanEcuadorianEnglishEstonianEthiopianEuropeanFijianFilipinoFinnishFrenchFrench American IndianFrench CanadianGermanGerman RussianGhanaianGreekGuamanian/ChamorroGuatemalanGuyaneseHaitianHmongHonduranHopiHoumaHungarianIcelanderIndian (Asian)IndonesianInupiatIranianIraqiIrishIroquoisIsraeliItalianJamaicanJapaneseJordanianKenyanKiowaKoreanLaotianLatvianLebaneseLiberianLithuanianLumbeeLuxembourgerMacedonianMalaysianMalteseMarshalleseMenomineeMexicanMexican American IndianMongolianMoroccanNative HawaiianNavajoNepaleseNew ZealanderNicaraguanNigerianNorthern EuropeanNorwegianOkinawanOsageOttawaPaiutePakistaniPalestinianPanamanianParaguayanPennsylvania GermanPeruvianPimaPolishPortuguesePotawatomiPuebloPuerto RicanPuget Sound SalishRomanianRussianSalvadoranSamoanScandinavianScotch-IrishScottishSeminoleSenegaleseSerbianShoshoneSierra LeoneanSiouxSlavicSlovakSloveneSomaliSouth AfricanSouth AmericanSouth American IndianSoviet UnionSpaniardSpanishSpanish AmericanSpanish American IndianSri LankanSubsaharan AfricanSudaneseSwedishSwissSyrianTaiwaneseThaiTlingit-HaidaTohono O'OdhamTonganTrinidadian and TobagonianTsimshianTurkishU.S. Virgin IslanderUgandanUkrainianUruguayanUteVenezuelanVietnameseWelshWest IndianYakamaYaquiYugoslavianYumanYup'ikZimbabwean
Immigration
NonimmigrantsImmigrantsAfghanistanAfricaAlbaniaArgentinaArmeniaAsiaAustraliaAustriaBahamasBangladeshBarbadosBelarusBelgiumBelizeBoliviaBosnia and HerzegovinaBrazilBulgariaBurma/MyanmarCabo VerdeCambodiaCameroonCanadaCaribbeanCentral AmericaChileChinaColombiaCongoCosta RicaCroatiaCubaCzechoslovakiaDenmarkDominicaDominican RepublicEastern AfricaEastern AsiaEastern EuropeEcuadorEgyptEl SalvadorEnglandEritreaEthiopiaEuropeFijiFranceGermanyGhanaGreeceGrenadaGuatemalaGuyanaHaitiHondurasHong KongHungaryIndiaIndonesiaIranIraqIrelandIsraelItalyJamaicaJapanJordanKazakhstanKenyaKoreaKuwaitLaosLatin AmericaLatviaLebanonLiberiaLithuaniaMalaysiaMexicoMicronesiaMiddle AfricaMoldovaMoroccoNepalNetherlandsNicaraguaNigeriaNorth AmericaNorth MacedoniaNorthern AfricaNorthern EuropeNorwayOceaniaPakistanPanamaPeruPhilippinesPolandPortugalRomaniaRussiaSaudi ArabiaScotlandSenegalSerbiaSierra LeoneSingaporeSomaliaSouth AfricaSouth AmericaSouth Central AsiaSouth Eastern AsiaSouthern EuropeSpainSri LankaSt. Vincent and the GrenadinesSudanSwedenSwitzerlandSyriaTaiwanThailandTrinidad and TobagoTurkeyUgandaUkraineUruguayUzbekistanVenezuelaVietnamWest IndiesWestern AfricaWestern AsiaWestern EuropeYemenZaireZimbabweAzores
Egyptian
Race
Ancestry
AfghanAfricanAlaska NativeAlaskan AthabascanAlbanianAleutAlsatianAmericanApacheArabArapahoArgentineanArmenianAssyrian/Chaldean/SyriacAustralianAustrianBahamianBangladeshiBarbadianBasqueBelgianBelizeanBermudanBhutaneseBlackfeetBolivianBrazilianBritishBritish West IndianBulgarianBurmeseCajunCambodianCanadianCape VerdeanCarpatho RusynCelticCentral AmericanCentral American IndianCherokeeCheyenneChickasawChileanChineseChippewaChoctawColombianColvilleComancheCosta RicanCreeCreekCroatianCrowCubanCypriotCzechCzechoslovakianDanishDelawareDominicanDutchDutch West IndianEastern EuropeanEcuadorianEgyptianEnglishEstonianEthiopianEuropeanFijianFilipinoFinnishFrenchFrench American IndianFrench CanadianGermanGerman RussianGhanaianGreekGuamanian/ChamorroGuatemalanGuyaneseHaitianHmongHonduranHopiHoumaHungarianIcelanderIndian (Asian)IndonesianInupiatIranianIraqiIrishIroquoisIsraeliItalianJamaicanJapaneseJordanianKenyanKiowaKoreanLaotianLatvianLebaneseLiberianLithuanianLumbeeLuxembourgerMacedonianMalaysianMalteseMarshalleseMenomineeMexicanMexican American IndianMongolianMoroccanNative HawaiianNavajoNepaleseNew ZealanderNicaraguanNigerianNorthern EuropeanNorwegianOkinawanOsageOttawaPaiutePakistaniPalestinianPanamanianParaguayanPennsylvania GermanPeruvianPimaPolishPortuguesePotawatomiPuebloPuerto RicanPuget Sound SalishRomanianRussianSalvadoranSamoanScandinavianScotch-IrishScottishSeminoleSenegaleseSerbianShoshoneSierra LeoneanSiouxSlavicSlovakSloveneSomaliSouth AfricanSouth AmericanSouth American IndianSoviet UnionSpaniardSpanishSpanish AmericanSpanish American IndianSri LankanSubsaharan AfricanSudaneseSwedishSwissSyrianTaiwaneseThaiTlingit-HaidaTohono O'OdhamTonganTrinidadian and TobagonianTsimshianTurkishU.S. Virgin IslanderUgandanUkrainianUruguayanUteVenezuelanWelshWest IndianYakamaYaquiYugoslavianYumanYup'ikZimbabwean
Immigration
NonimmigrantsImmigrantsAfghanistanAfricaAlbaniaArgentinaArmeniaAsiaAustraliaAustriaBahamasBangladeshBarbadosBelarusBelgiumBelizeBoliviaBosnia and HerzegovinaBrazilBulgariaBurma/MyanmarCabo VerdeCambodiaCameroonCanadaCaribbeanCentral AmericaChileChinaColombiaCongoCosta RicaCroatiaCubaCzechoslovakiaDenmarkDominicaDominican RepublicEastern AfricaEastern AsiaEastern EuropeEcuadorEgyptEl SalvadorEnglandEritreaEthiopiaEuropeFijiFranceGermanyGhanaGreeceGrenadaGuatemalaGuyanaHaitiHondurasHong KongHungaryIndiaIndonesiaIranIraqIrelandIsraelItalyJamaicaJapanJordanKazakhstanKenyaKoreaKuwaitLaosLatin AmericaLatviaLebanonLiberiaLithuaniaMalaysiaMexicoMicronesiaMiddle AfricaMoldovaMoroccoNepalNetherlandsNicaraguaNigeriaNorth AmericaNorth MacedoniaNorthern AfricaNorthern EuropeNorwayOceaniaPakistanPanamaPeruPhilippinesPolandPortugalRomaniaRussiaSaudi ArabiaScotlandSenegalSerbiaSierra LeoneSingaporeSomaliaSouth AfricaSouth AmericaSouth Central AsiaSouth Eastern AsiaSouthern EuropeSpainSri LankaSt. Vincent and the GrenadinesSudanSwedenSwitzerlandSyriaTaiwanThailandTrinidad and TobagoTurkeyUgandaUkraineUruguayUzbekistanVenezuelaVietnamWest IndiesWestern AfricaWestern AsiaWestern EuropeYemenZaireZimbabweAzores
12th Grade, No Diploma
Income
Poverty
Unemployment
Labor Participation
Family Structure
Vehicle Availability
Education Level
Disability

12th Grade, No Diploma Comparison

Vietnamese

Egyptians

Tragic
Exceptional
87.9%
12TH GRADE, NO DIPLOMA
0.0/ 100
METRIC RATING
304th/ 347
METRIC RANK
91.9%
12TH GRADE, NO DIPLOMA
92.5/ 100
METRIC RATING
123rd/ 347
METRIC RANK

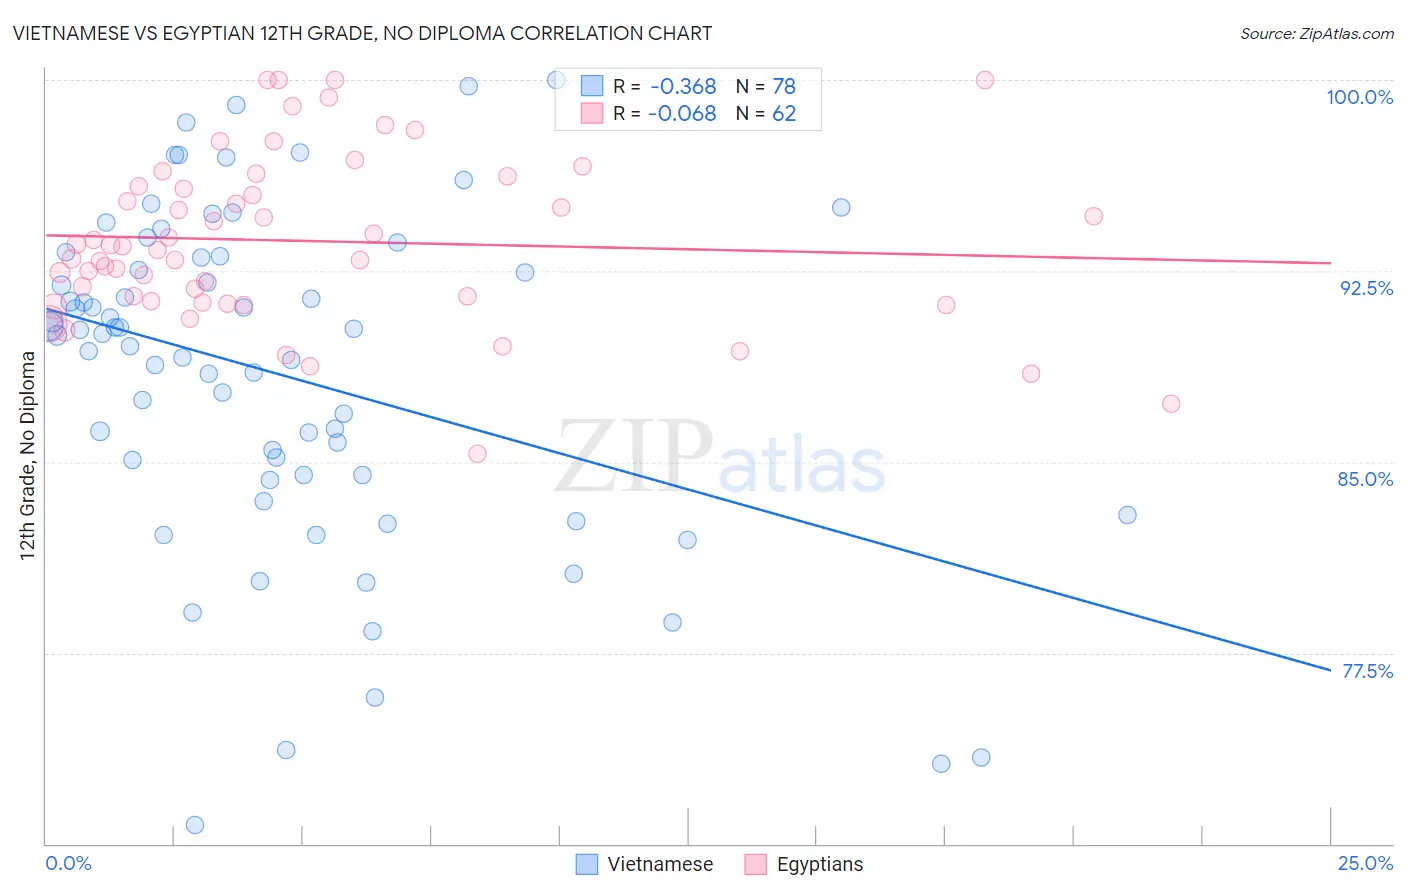
Vietnamese vs Egyptian 12th Grade, No Diploma Correlation Chart

The statistical analysis conducted on geographies consisting of 170,753,564 people shows a mild negative correlation between the proportion of Vietnamese and percentage of population with at least 12th grade (no diploma) education in the United States with a correlation coefficient (R) of -0.368 and weighted average of 87.9%. Similarly, the statistical analysis conducted on geographies consisting of 276,926,364 people shows a slight negative correlation between the proportion of Egyptians and percentage of population with at least 12th grade (no diploma) education in the United States with a correlation coefficient (R) of -0.068 and weighted average of 91.9%, a difference of 4.5%.
Vietnamese vs Egyptian 12th Grade, No Diploma

12th Grade, No Diploma Correlation Summary

MeasurementVietnameseEgyptian
Minimum70.7%85.3%
Maximum100.0%100.0%
Range29.3%14.7%
Mean88.4%93.7%
Median90.0%93.4%
Interquartile 25% (IQ1)84.5%91.3%
Interquartile 75% (IQ3)93.0%95.8%
Interquartile Range (IQR)8.5%4.5%
Standard Deviation (Sample)6.6%3.3%
Standard Deviation (Population)6.5%3.3%

Similar Demographics by 12th Grade, No Diploma

Demographics Similar to Vietnamese by 12th Grade, No Diploma

In terms of 12th grade, no diploma, the demographic groups most similar to Vietnamese are Immigrants from Bangladesh (88.0%, a difference of 0.060%), Ecuadorian (88.0%, a difference of 0.17%), Immigrants from Guyana (88.1%, a difference of 0.19%), Immigrants from Cambodia (88.1%, a difference of 0.19%), and Immigrants from Dominica (87.7%, a difference of 0.19%).
DemographicsRating | Rank12th Grade, No Diploma
Pueblo
0.0
/100
|
#297
Tragic
88.2%
Immigrants | Haiti
0.0
/100
|
#298
Tragic
88.2%
Nepalese
0.0
/100
|
#299
Tragic
88.1%
Immigrants | Guyana
0.0
/100
|
#300
Tragic
88.1%
Immigrants | Cambodia
0.0
/100
|
#301
Tragic
88.1%
Ecuadorians
0.0
/100
|
#302
Tragic
88.0%
Immigrants | Bangladesh
0.0
/100
|
#303
Tragic
88.0%
Vietnamese
0.0
/100
|
#304
Tragic
87.9%
Immigrants | Dominica
0.0
/100
|
#305
Tragic
87.7%
Natives/Alaskans
0.0
/100
|
#306
Tragic
87.7%
Immigrants | Portugal
0.0
/100
|
#307
Tragic
87.6%
Yup'ik
0.0
/100
|
#308
Tragic
87.6%
Immigrants | Armenia
0.0
/100
|
#309
Tragic
87.6%
Immigrants | Cuba
0.0
/100
|
#310
Tragic
87.5%
Yaqui
0.0
/100
|
#311
Tragic
87.5%

Demographics Similar to Egyptians by 12th Grade, No Diploma

In terms of 12th grade, no diploma, the demographic groups most similar to Egyptians are Ottawa (91.9%, a difference of 0.030%), Immigrants from Ukraine (91.8%, a difference of 0.040%), White/Caucasian (91.8%, a difference of 0.040%), Menominee (91.9%, a difference of 0.050%), and Basque (91.8%, a difference of 0.050%).
DemographicsRating | Rank12th Grade, No Diploma
Aleuts
96.3
/100
|
#116
Exceptional
92.1%
Immigrants | Eastern Europe
96.3
/100
|
#117
Exceptional
92.1%
Puget Sound Salish
95.8
/100
|
#118
Exceptional
92.0%
Immigrants | Germany
95.5
/100
|
#119
Exceptional
92.0%
Immigrants | Kazakhstan
94.2
/100
|
#120
Exceptional
91.9%
Menominee
93.5
/100
|
#121
Exceptional
91.9%
Ottawa
93.1
/100
|
#122
Exceptional
91.9%
Egyptians
92.5
/100
|
#123
Exceptional
91.9%
Immigrants | Ukraine
91.6
/100
|
#124
Exceptional
91.8%
Whites/Caucasians
91.6
/100
|
#125
Exceptional
91.8%
Basques
91.3
/100
|
#126
Exceptional
91.8%
Immigrants | Jordan
91.0
/100
|
#127
Exceptional
91.8%
Mongolians
89.9
/100
|
#128
Excellent
91.8%
German Russians
89.8
/100
|
#129
Excellent
91.8%
Assyrians/Chaldeans/Syriacs
89.6
/100
|
#130
Excellent
91.8%