Potawatomi vs Immigrants from Micronesia 8th Grade
COMPARE
Potawatomi
Immigrants from Micronesia
8th Grade
8th Grade Comparison
Potawatomi
Immigrants from Micronesia
96.4%
8TH GRADE
98.7/ 100
METRIC RATING
96th/ 347
METRIC RANK
95.6%
8TH GRADE
31.6/ 100
METRIC RATING
189th/ 347
METRIC RANK
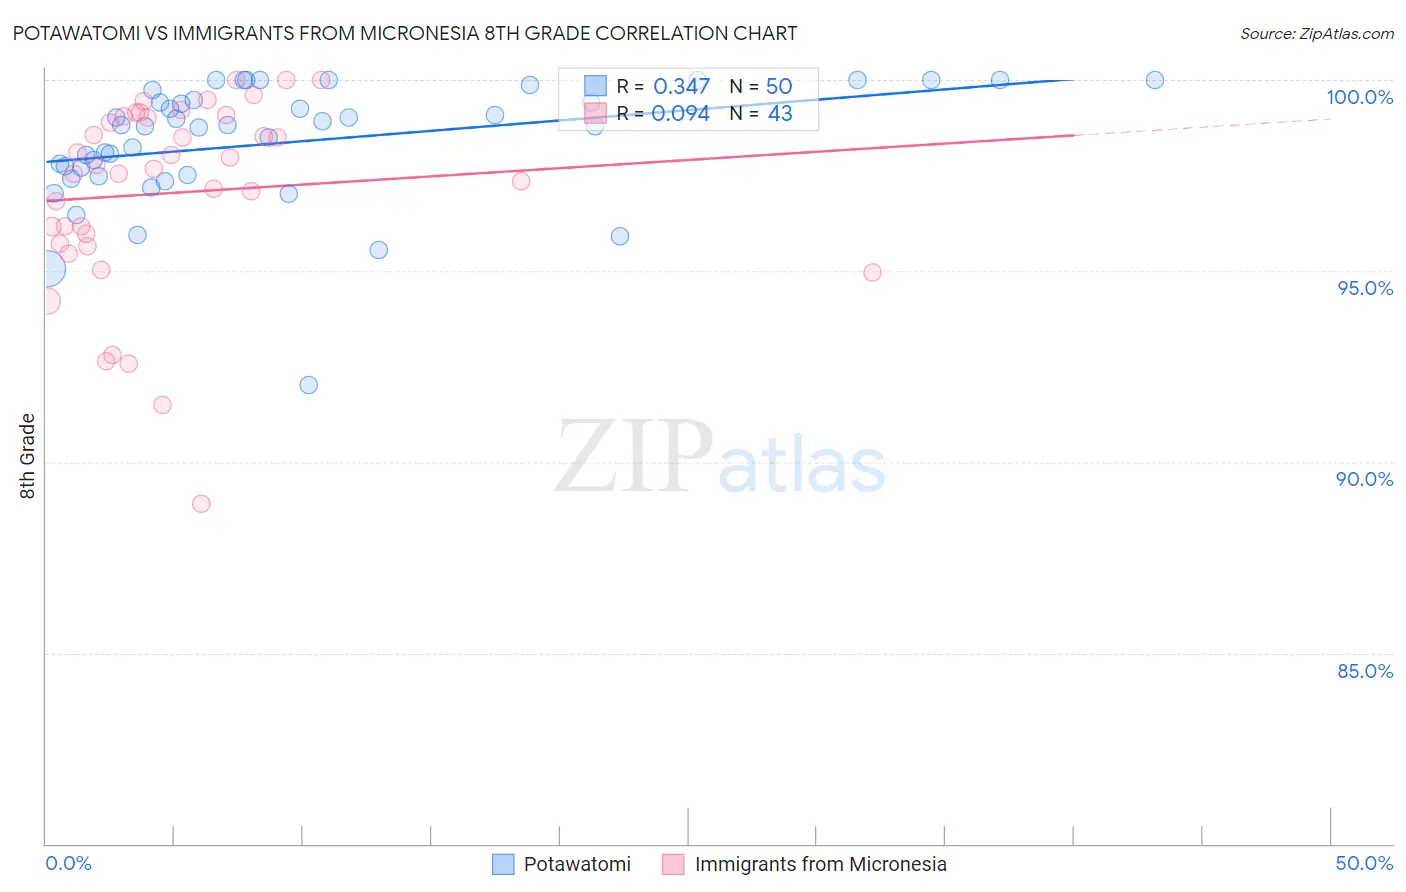
Potawatomi vs Immigrants from Micronesia 8th Grade Correlation Chart
The statistical analysis conducted on geographies consisting of 117,769,196 people shows a mild positive correlation between the proportion of Potawatomi and percentage of population with at least 8th grade education in the United States with a correlation coefficient (R) of 0.347 and weighted average of 96.4%. Similarly, the statistical analysis conducted on geographies consisting of 61,604,657 people shows a slight positive correlation between the proportion of Immigrants from Micronesia and percentage of population with at least 8th grade education in the United States with a correlation coefficient (R) of 0.094 and weighted average of 95.6%, a difference of 0.83%.
8th Grade Correlation Summary
| Measurement | Potawatomi | Immigrants from Micronesia |
| Minimum | 92.0% | 88.9% |
| Maximum | 100.0% | 100.0% |
| Range | 8.0% | 11.1% |
| Mean | 98.4% | 97.0% |
| Median | 98.8% | 97.7% |
| Interquartile 25% (IQ1) | 97.5% | 95.7% |
| Interquartile 75% (IQ3) | 99.5% | 99.1% |
| Interquartile Range (IQR) | 2.0% | 3.4% |
| Standard Deviation (Sample) | 1.6% | 2.5% |
| Standard Deviation (Population) | 1.6% | 2.5% |
Similar Demographics by 8th Grade
Demographics Similar to Potawatomi by 8th Grade
In terms of 8th grade, the demographic groups most similar to Potawatomi are Osage (96.4%, a difference of 0.0%), Immigrants from Germany (96.4%, a difference of 0.0%), Immigrants from Singapore (96.4%, a difference of 0.010%), German Russian (96.4%, a difference of 0.010%), and Cree (96.4%, a difference of 0.010%).
| Demographics | Rating | Rank | 8th Grade |
| Chickasaw | 98.9 /100 | #89 | Exceptional 96.4% |
| Immigrants | Sweden | 98.9 /100 | #90 | Exceptional 96.4% |
| Thais | 98.9 /100 | #91 | Exceptional 96.4% |
| Menominee | 98.9 /100 | #92 | Exceptional 96.4% |
| Immigrants | Denmark | 98.8 /100 | #93 | Exceptional 96.4% |
| Immigrants | Singapore | 98.8 /100 | #94 | Exceptional 96.4% |
| German Russians | 98.8 /100 | #95 | Exceptional 96.4% |
| Potawatomi | 98.7 /100 | #96 | Exceptional 96.4% |
| Osage | 98.7 /100 | #97 | Exceptional 96.4% |
| Immigrants | Germany | 98.7 /100 | #98 | Exceptional 96.4% |
| Cree | 98.6 /100 | #99 | Exceptional 96.4% |
| Immigrants | Czechoslovakia | 98.6 /100 | #100 | Exceptional 96.4% |
| Bhutanese | 98.2 /100 | #101 | Exceptional 96.4% |
| South Africans | 98.2 /100 | #102 | Exceptional 96.4% |
| Immigrants | Saudi Arabia | 98.0 /100 | #103 | Exceptional 96.3% |
Demographics Similar to Immigrants from Micronesia by 8th Grade
In terms of 8th grade, the demographic groups most similar to Immigrants from Micronesia are Sudanese (95.6%, a difference of 0.010%), Liberian (95.6%, a difference of 0.010%), Immigrants from Venezuela (95.6%, a difference of 0.010%), Immigrants from Nepal (95.6%, a difference of 0.010%), and Black/African American (95.6%, a difference of 0.020%).
| Demographics | Rating | Rank | 8th Grade |
| Immigrants | Egypt | 37.9 /100 | #182 | Fair 95.7% |
| Immigrants | Iraq | 36.2 /100 | #183 | Fair 95.6% |
| Immigrants | Uganda | 36.0 /100 | #184 | Fair 95.6% |
| Blacks/African Americans | 34.8 /100 | #185 | Fair 95.6% |
| Brazilians | 34.8 /100 | #186 | Fair 95.6% |
| Sudanese | 33.0 /100 | #187 | Fair 95.6% |
| Liberians | 32.4 /100 | #188 | Fair 95.6% |
| Immigrants | Micronesia | 31.6 /100 | #189 | Fair 95.6% |
| Immigrants | Venezuela | 30.8 /100 | #190 | Fair 95.6% |
| Immigrants | Nepal | 30.2 /100 | #191 | Fair 95.6% |
| Pima | 28.6 /100 | #192 | Fair 95.6% |
| Panamanians | 28.4 /100 | #193 | Fair 95.6% |
| Guamanians/Chamorros | 26.6 /100 | #194 | Fair 95.6% |
| Immigrants | Zaire | 25.2 /100 | #195 | Fair 95.6% |
| Assyrians/Chaldeans/Syriacs | 24.5 /100 | #196 | Fair 95.6% |