Immigrants from Western Africa vs Immigrants from Egypt 9th Grade
COMPARE
Immigrants from Western Africa
Immigrants from Egypt
9th Grade
9th Grade Comparison
Immigrants from Western Africa
Immigrants from Egypt
93.8%
9TH GRADE
0.2/ 100
METRIC RATING
272nd/ 347
METRIC RANK
94.9%
9TH GRADE
50.0/ 100
METRIC RATING
174th/ 347
METRIC RANK
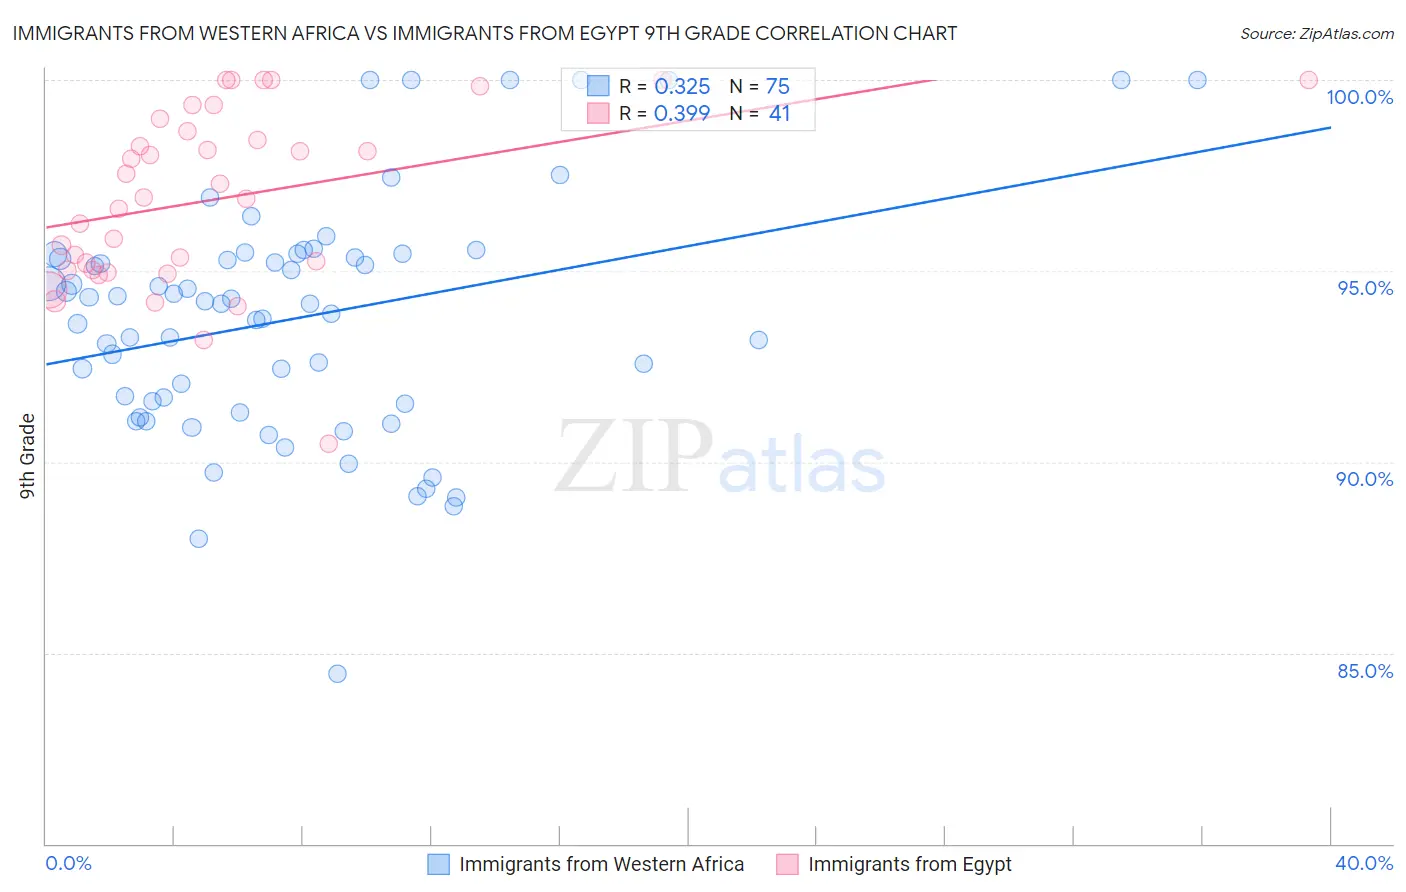
Immigrants from Western Africa vs Immigrants from Egypt 9th Grade Correlation Chart
The statistical analysis conducted on geographies consisting of 357,883,667 people shows a mild positive correlation between the proportion of Immigrants from Western Africa and percentage of population with at least 9th grade education in the United States with a correlation coefficient (R) of 0.325 and weighted average of 93.8%. Similarly, the statistical analysis conducted on geographies consisting of 245,485,794 people shows a mild positive correlation between the proportion of Immigrants from Egypt and percentage of population with at least 9th grade education in the United States with a correlation coefficient (R) of 0.399 and weighted average of 94.9%, a difference of 1.2%.
9th Grade Correlation Summary
| Measurement | Immigrants from Western Africa | Immigrants from Egypt |
| Minimum | 84.5% | 90.5% |
| Maximum | 100.0% | 100.0% |
| Range | 15.5% | 9.5% |
| Mean | 93.8% | 96.9% |
| Median | 94.1% | 96.9% |
| Interquartile 25% (IQ1) | 91.5% | 95.0% |
| Interquartile 75% (IQ3) | 95.4% | 98.8% |
| Interquartile Range (IQR) | 3.9% | 3.8% |
| Standard Deviation (Sample) | 3.1% | 2.3% |
| Standard Deviation (Population) | 3.1% | 2.3% |
Similar Demographics by 9th Grade
Demographics Similar to Immigrants from Western Africa by 9th Grade
In terms of 9th grade, the demographic groups most similar to Immigrants from Western Africa are Immigrants from Ghana (93.8%, a difference of 0.010%), Immigrants from South America (93.8%, a difference of 0.010%), Peruvian (93.8%, a difference of 0.010%), Immigrants from Colombia (93.8%, a difference of 0.020%), and Yuman (93.8%, a difference of 0.030%).
| Demographics | Rating | Rank | 9th Grade |
| Natives/Alaskans | 0.4 /100 | #265 | Tragic 93.9% |
| Navajo | 0.3 /100 | #266 | Tragic 93.9% |
| Armenians | 0.3 /100 | #267 | Tragic 93.9% |
| Immigrants | Bolivia | 0.3 /100 | #268 | Tragic 93.9% |
| Immigrants | Uruguay | 0.2 /100 | #269 | Tragic 93.8% |
| Yuman | 0.2 /100 | #270 | Tragic 93.8% |
| Immigrants | Ghana | 0.2 /100 | #271 | Tragic 93.8% |
| Immigrants | Western Africa | 0.2 /100 | #272 | Tragic 93.8% |
| Immigrants | South America | 0.2 /100 | #273 | Tragic 93.8% |
| Peruvians | 0.2 /100 | #274 | Tragic 93.8% |
| Immigrants | Colombia | 0.2 /100 | #275 | Tragic 93.8% |
| West Indians | 0.2 /100 | #276 | Tragic 93.7% |
| Immigrants | Philippines | 0.1 /100 | #277 | Tragic 93.7% |
| Immigrants | Eritrea | 0.1 /100 | #278 | Tragic 93.7% |
| Trinidadians and Tobagonians | 0.1 /100 | #279 | Tragic 93.7% |
Demographics Similar to Immigrants from Egypt by 9th Grade
In terms of 9th grade, the demographic groups most similar to Immigrants from Egypt are Brazilian (94.9%, a difference of 0.0%), Cheyenne (94.9%, a difference of 0.010%), Immigrants from Spain (94.9%, a difference of 0.010%), Immigrants from Iraq (94.9%, a difference of 0.020%), and Immigrants from Poland (94.9%, a difference of 0.020%).
| Demographics | Rating | Rank | 9th Grade |
| Immigrants | Brazil | 61.1 /100 | #167 | Good 95.0% |
| Chileans | 60.7 /100 | #168 | Good 95.0% |
| Spaniards | 59.6 /100 | #169 | Average 94.9% |
| Alsatians | 58.6 /100 | #170 | Average 94.9% |
| Colville | 58.5 /100 | #171 | Average 94.9% |
| Iraqis | 54.0 /100 | #172 | Average 94.9% |
| Cheyenne | 51.5 /100 | #173 | Average 94.9% |
| Immigrants | Egypt | 50.0 /100 | #174 | Average 94.9% |
| Brazilians | 49.8 /100 | #175 | Average 94.9% |
| Immigrants | Spain | 49.1 /100 | #176 | Average 94.9% |
| Immigrants | Iraq | 47.8 /100 | #177 | Average 94.9% |
| Immigrants | Poland | 46.7 /100 | #178 | Average 94.9% |
| Immigrants | Venezuela | 46.5 /100 | #179 | Average 94.9% |
| Immigrants | Uganda | 43.1 /100 | #180 | Average 94.8% |
| Sierra Leoneans | 42.7 /100 | #181 | Average 94.8% |