Asian vs Icelander 12th Grade, No Diploma

COMPARE

Asian
Race
Ancestry
AfghanAfricanAlaska NativeAlaskan AthabascanAlbanianAleutAlsatianAmericanApacheArabArapahoArgentineanArmenianAssyrian/Chaldean/SyriacAustralianAustrianBahamianBangladeshiBarbadianBasqueBelgianBelizeanBermudanBhutaneseBlackfeetBolivianBrazilianBritishBritish West IndianBulgarianBurmeseCajunCambodianCanadianCape VerdeanCarpatho RusynCelticCentral AmericanCentral American IndianCherokeeCheyenneChickasawChileanChineseChippewaChoctawColombianColvilleComancheCosta RicanCreeCreekCroatianCrowCubanCypriotCzechCzechoslovakianDanishDelawareDominicanDutchDutch West IndianEastern EuropeanEcuadorianEgyptianEnglishEstonianEthiopianEuropeanFijianFilipinoFinnishFrenchFrench American IndianFrench CanadianGermanGerman RussianGhanaianGreekGuamanian/ChamorroGuatemalanGuyaneseHaitianHmongHonduranHopiHoumaHungarianIndian (Asian)IndonesianInupiatIranianIraqiIrishIroquoisIsraeliItalianJamaicanJapaneseJordanianKenyanKiowaKoreanLaotianLatvianLebaneseLiberianLithuanianLumbeeLuxembourgerMacedonianMalaysianMalteseMarshalleseMenomineeMexicanMexican American IndianMongolianMoroccanNative HawaiianNavajoNepaleseNew ZealanderNicaraguanNigerianNorthern EuropeanNorwegianOkinawanOsageOttawaPaiutePakistaniPalestinianPanamanianParaguayanPennsylvania GermanPeruvianPimaPolishPortuguesePotawatomiPuebloPuerto RicanPuget Sound SalishRomanianRussianSalvadoranSamoanScandinavianScotch-IrishScottishSeminoleSenegaleseSerbianShoshoneSierra LeoneanSiouxSlavicSlovakSloveneSomaliSouth AfricanSouth AmericanSouth American IndianSoviet UnionSpaniardSpanishSpanish AmericanSpanish American IndianSri LankanSubsaharan AfricanSudaneseSwedishSwissSyrianTaiwaneseThaiTlingit-HaidaTohono O'OdhamTonganTrinidadian and TobagonianTsimshianTurkishU.S. Virgin IslanderUgandanUkrainianUruguayanUteVenezuelanVietnameseWelshWest IndianYakamaYaquiYugoslavianYumanYup'ikZimbabwean
Immigration
NonimmigrantsImmigrantsAfghanistanAfricaAlbaniaArgentinaArmeniaAsiaAustraliaAustriaBahamasBangladeshBarbadosBelarusBelgiumBelizeBoliviaBosnia and HerzegovinaBrazilBulgariaBurma/MyanmarCabo VerdeCambodiaCameroonCanadaCaribbeanCentral AmericaChileChinaColombiaCongoCosta RicaCroatiaCubaCzechoslovakiaDenmarkDominicaDominican RepublicEastern AfricaEastern AsiaEastern EuropeEcuadorEgyptEl SalvadorEnglandEritreaEthiopiaEuropeFijiFranceGermanyGhanaGreeceGrenadaGuatemalaGuyanaHaitiHondurasHong KongHungaryIndiaIndonesiaIranIraqIrelandIsraelItalyJamaicaJapanJordanKazakhstanKenyaKoreaKuwaitLaosLatin AmericaLatviaLebanonLiberiaLithuaniaMalaysiaMexicoMicronesiaMiddle AfricaMoldovaMoroccoNepalNetherlandsNicaraguaNigeriaNorth AmericaNorth MacedoniaNorthern AfricaNorthern EuropeNorwayOceaniaPakistanPanamaPeruPhilippinesPolandPortugalRomaniaRussiaSaudi ArabiaScotlandSenegalSerbiaSierra LeoneSingaporeSomaliaSouth AfricaSouth AmericaSouth Central AsiaSouth Eastern AsiaSouthern EuropeSpainSri LankaSt. Vincent and the GrenadinesSudanSwedenSwitzerlandSyriaTaiwanThailandTrinidad and TobagoTurkeyUgandaUkraineUruguayUzbekistanVenezuelaVietnamWest IndiesWestern AfricaWestern AsiaWestern EuropeYemenZaireZimbabweAzores
Icelander
Race
Ancestry
AfghanAfricanAlaska NativeAlaskan AthabascanAlbanianAleutAlsatianAmericanApacheArabArapahoArgentineanArmenianAssyrian/Chaldean/SyriacAustralianAustrianBahamianBangladeshiBarbadianBasqueBelgianBelizeanBermudanBhutaneseBlackfeetBolivianBrazilianBritishBritish West IndianBulgarianBurmeseCajunCambodianCanadianCape VerdeanCarpatho RusynCelticCentral AmericanCentral American IndianCherokeeCheyenneChickasawChileanChineseChippewaChoctawColombianColvilleComancheCosta RicanCreeCreekCroatianCrowCubanCypriotCzechCzechoslovakianDanishDelawareDominicanDutchDutch West IndianEastern EuropeanEcuadorianEgyptianEnglishEstonianEthiopianEuropeanFijianFilipinoFinnishFrenchFrench American IndianFrench CanadianGermanGerman RussianGhanaianGreekGuamanian/ChamorroGuatemalanGuyaneseHaitianHmongHonduranHopiHoumaHungarianIcelanderIndian (Asian)IndonesianInupiatIranianIraqiIrishIroquoisIsraeliItalianJamaicanJapaneseJordanianKenyanKiowaKoreanLaotianLatvianLebaneseLiberianLithuanianLumbeeLuxembourgerMacedonianMalaysianMalteseMarshalleseMenomineeMexicanMexican American IndianMongolianMoroccanNative HawaiianNavajoNepaleseNew ZealanderNicaraguanNigerianNorthern EuropeanNorwegianOkinawanOsageOttawaPaiutePakistaniPalestinianPanamanianParaguayanPennsylvania GermanPeruvianPimaPolishPortuguesePotawatomiPuebloPuerto RicanPuget Sound SalishRomanianRussianSalvadoranSamoanScandinavianScotch-IrishScottishSeminoleSenegaleseSerbianShoshoneSierra LeoneanSiouxSlavicSlovakSloveneSomaliSouth AfricanSouth AmericanSouth American IndianSoviet UnionSpaniardSpanishSpanish AmericanSpanish American IndianSri LankanSubsaharan AfricanSudaneseSwedishSwissSyrianTaiwaneseThaiTlingit-HaidaTohono O'OdhamTonganTrinidadian and TobagonianTsimshianTurkishU.S. Virgin IslanderUgandanUkrainianUruguayanUteVenezuelanVietnameseWelshWest IndianYakamaYaquiYugoslavianYumanYup'ikZimbabwean
Immigration
NonimmigrantsImmigrantsAfghanistanAfricaAlbaniaArgentinaArmeniaAsiaAustraliaAustriaBahamasBangladeshBarbadosBelarusBelgiumBelizeBoliviaBosnia and HerzegovinaBrazilBulgariaBurma/MyanmarCabo VerdeCambodiaCameroonCanadaCaribbeanCentral AmericaChileChinaColombiaCongoCosta RicaCroatiaCubaCzechoslovakiaDenmarkDominicaDominican RepublicEastern AfricaEastern AsiaEastern EuropeEcuadorEgyptEl SalvadorEnglandEritreaEthiopiaEuropeFijiFranceGermanyGhanaGreeceGrenadaGuatemalaGuyanaHaitiHondurasHong KongHungaryIndiaIndonesiaIranIraqIrelandIsraelItalyJamaicaJapanJordanKazakhstanKenyaKoreaKuwaitLaosLatin AmericaLatviaLebanonLiberiaLithuaniaMalaysiaMexicoMicronesiaMiddle AfricaMoldovaMoroccoNepalNetherlandsNicaraguaNigeriaNorth AmericaNorth MacedoniaNorthern AfricaNorthern EuropeNorwayOceaniaPakistanPanamaPeruPhilippinesPolandPortugalRomaniaRussiaSaudi ArabiaScotlandSenegalSerbiaSierra LeoneSingaporeSomaliaSouth AfricaSouth AmericaSouth Central AsiaSouth Eastern AsiaSouthern EuropeSpainSri LankaSt. Vincent and the GrenadinesSudanSwedenSwitzerlandSyriaTaiwanThailandTrinidad and TobagoTurkeyUgandaUkraineUruguayUzbekistanVenezuelaVietnamWest IndiesWestern AfricaWestern AsiaWestern EuropeYemenZaireZimbabweAzores
12th Grade, No Diploma
Income
Poverty
Unemployment
Labor Participation
Family Structure
Vehicle Availability
Education Level
Disability

12th Grade, No Diploma Comparison

Asians

Icelanders

Good
Exceptional
91.4%
12TH GRADE, NO DIPLOMA
71.9/ 100
METRIC RATING
156th/ 347
METRIC RANK
92.3%
12TH GRADE, NO DIPLOMA
98.5/ 100
METRIC RATING
96th/ 347
METRIC RANK

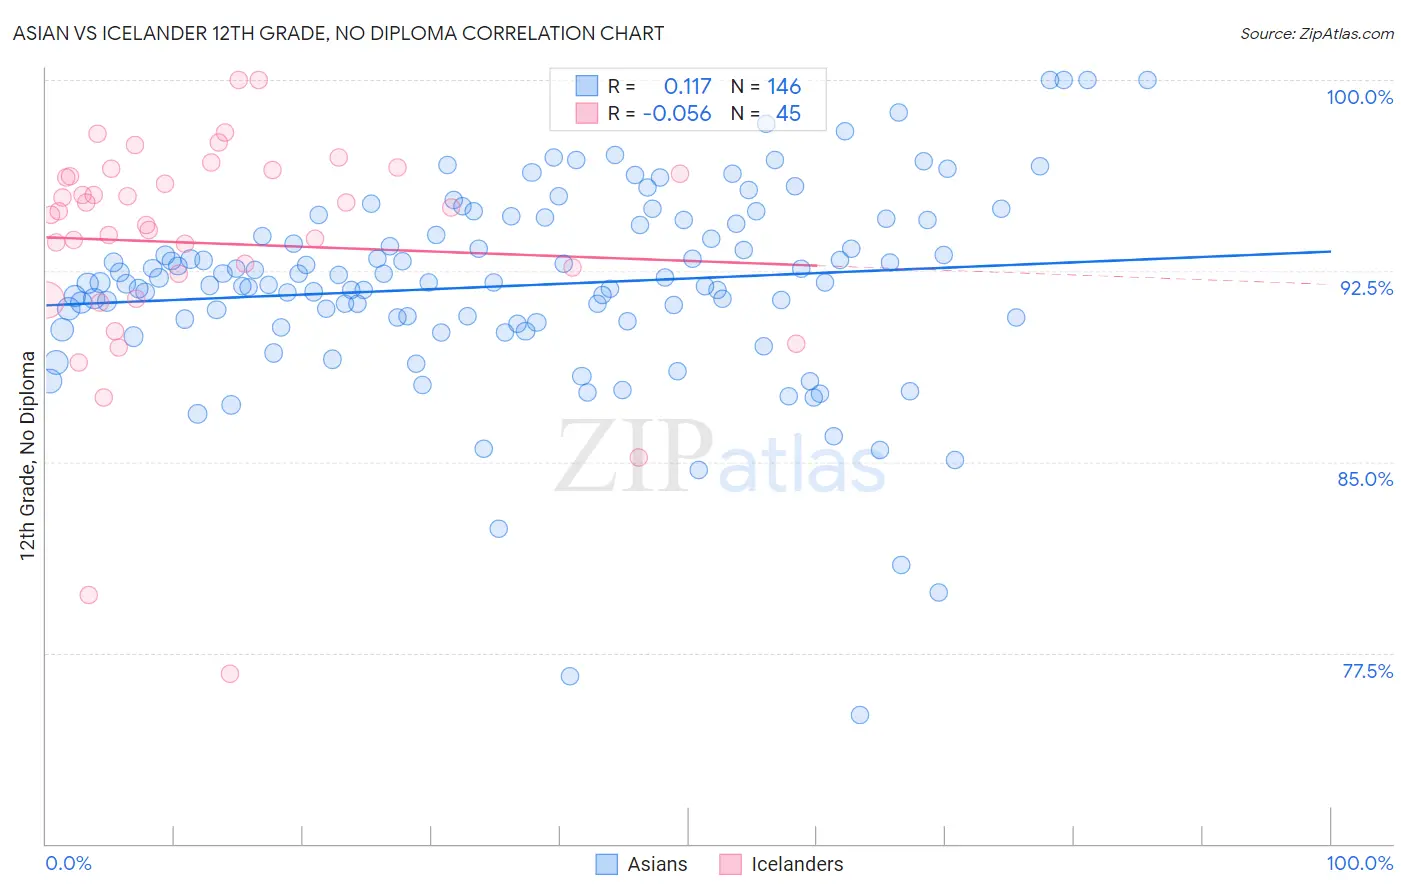
Asian vs Icelander 12th Grade, No Diploma Correlation Chart

The statistical analysis conducted on geographies consisting of 550,778,086 people shows a poor positive correlation between the proportion of Asians and percentage of population with at least 12th grade (no diploma) education in the United States with a correlation coefficient (R) of 0.117 and weighted average of 91.4%. Similarly, the statistical analysis conducted on geographies consisting of 159,668,816 people shows a slight negative correlation between the proportion of Icelanders and percentage of population with at least 12th grade (no diploma) education in the United States with a correlation coefficient (R) of -0.056 and weighted average of 92.3%, a difference of 0.99%.
Asian vs Icelander 12th Grade, No Diploma

12th Grade, No Diploma Correlation Summary

MeasurementAsianIcelander
Minimum75.1%76.7%
Maximum100.0%100.0%
Range24.9%23.3%
Mean91.9%93.6%
Median92.0%94.9%
Interquartile 25% (IQ1)90.5%91.9%
Interquartile 75% (IQ3)94.4%96.4%
Interquartile Range (IQR)3.8%4.5%
Standard Deviation (Sample)4.0%4.6%
Standard Deviation (Population)3.9%4.5%

Similar Demographics by 12th Grade, No Diploma

Demographics Similar to Asians by 12th Grade, No Diploma

In terms of 12th grade, no diploma, the demographic groups most similar to Asians are Immigrants from Iraq (91.4%, a difference of 0.020%), Immigrants from Pakistan (91.4%, a difference of 0.020%), Immigrants from Kenya (91.5%, a difference of 0.030%), Iraqi (91.5%, a difference of 0.050%), and Immigrants from Northern Africa (91.4%, a difference of 0.080%).
DemographicsRating | Rank12th Grade, No Diploma
Ugandans
79.0
/100
|
#149
Good
91.5%
Paraguayans
78.9
/100
|
#150
Good
91.5%
Chippewa
78.8
/100
|
#151
Good
91.5%
Kenyans
77.4
/100
|
#152
Good
91.5%
Iraqis
75.3
/100
|
#153
Good
91.5%
Immigrants | Kenya
73.9
/100
|
#154
Good
91.5%
Immigrants | Iraq
73.0
/100
|
#155
Good
91.4%
Asians
71.9
/100
|
#156
Good
91.4%
Immigrants | Pakistan
70.7
/100
|
#157
Good
91.4%
Immigrants | Northern Africa
66.2
/100
|
#158
Good
91.4%
Laotians
64.4
/100
|
#159
Good
91.3%
Immigrants | Albania
64.1
/100
|
#160
Good
91.3%
Immigrants | Hong Kong
63.8
/100
|
#161
Good
91.3%
Brazilians
62.0
/100
|
#162
Good
91.3%
Immigrants | Asia
61.5
/100
|
#163
Good
91.3%

Demographics Similar to Icelanders by 12th Grade, No Diploma

In terms of 12th grade, no diploma, the demographic groups most similar to Icelanders are Immigrants from Europe (92.3%, a difference of 0.0%), Immigrants from North Macedonia (92.3%, a difference of 0.0%), Celtic (92.3%, a difference of 0.010%), Immigrants from Kuwait (92.3%, a difference of 0.010%), and Immigrants from Romania (92.3%, a difference of 0.020%).
DemographicsRating | Rank12th Grade, No Diploma
Canadians
98.7
/100
|
#89
Exceptional
92.4%
Immigrants | Serbia
98.6
/100
|
#90
Exceptional
92.4%
South Africans
98.6
/100
|
#91
Exceptional
92.4%
Immigrants | Romania
98.5
/100
|
#92
Exceptional
92.3%
Immigrants | Western Europe
98.5
/100
|
#93
Exceptional
92.3%
Immigrants | Europe
98.5
/100
|
#94
Exceptional
92.3%
Immigrants | North Macedonia
98.5
/100
|
#95
Exceptional
92.3%
Icelanders
98.5
/100
|
#96
Exceptional
92.3%
Celtics
98.4
/100
|
#97
Exceptional
92.3%
Immigrants | Kuwait
98.4
/100
|
#98
Exceptional
92.3%
Immigrants | Korea
98.3
/100
|
#99
Exceptional
92.3%
Immigrants | Croatia
98.3
/100
|
#100
Exceptional
92.3%
Swiss
98.1
/100
|
#101
Exceptional
92.3%
Alaskan Athabascans
98.1
/100
|
#102
Exceptional
92.3%
Immigrants | Norway
98.1
/100
|
#103
Exceptional
92.3%