Luxembourger vs Immigrants from Ghana Professional Degree
COMPARE
Luxembourger
Immigrants from Ghana
Professional Degree
Professional Degree Comparison
Luxembourgers
Immigrants from Ghana
4.6%
PROFESSIONAL DEGREE
78.7/ 100
METRIC RATING
146th/ 347
METRIC RANK
4.1%
PROFESSIONAL DEGREE
10.6/ 100
METRIC RATING
214th/ 347
METRIC RANK
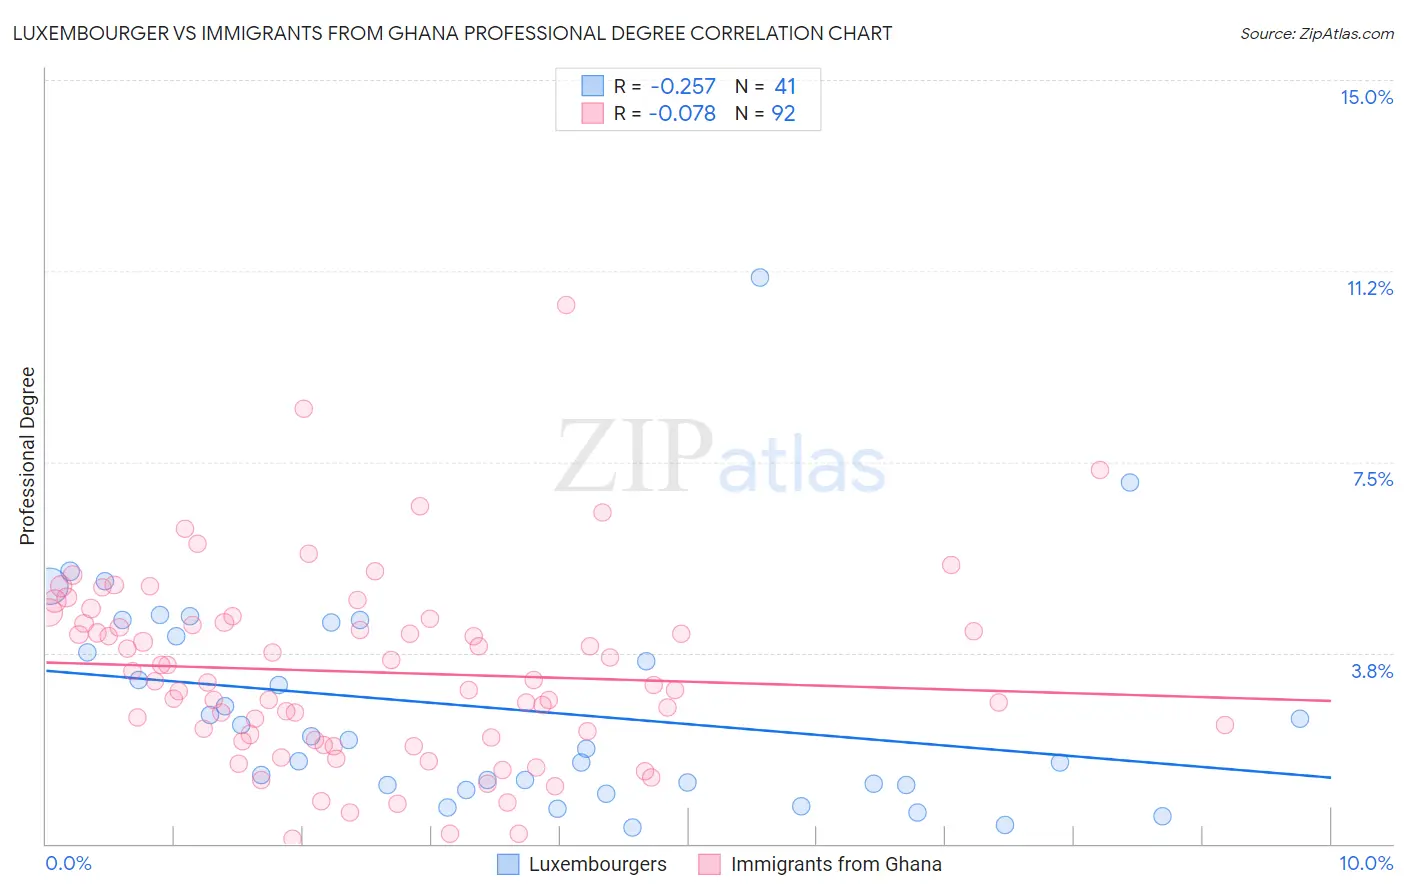
Luxembourger vs Immigrants from Ghana Professional Degree Correlation Chart
The statistical analysis conducted on geographies consisting of 144,524,005 people shows a weak negative correlation between the proportion of Luxembourgers and percentage of population with at least professional degree education in the United States with a correlation coefficient (R) of -0.257 and weighted average of 4.6%. Similarly, the statistical analysis conducted on geographies consisting of 199,711,542 people shows a slight negative correlation between the proportion of Immigrants from Ghana and percentage of population with at least professional degree education in the United States with a correlation coefficient (R) of -0.078 and weighted average of 4.1%, a difference of 13.6%.
Professional Degree Correlation Summary
| Measurement | Luxembourger | Immigrants from Ghana |
| Minimum | 0.31% | 0.098% |
| Maximum | 11.1% | 10.6% |
| Range | 10.8% | 10.5% |
| Mean | 2.7% | 3.4% |
| Median | 2.0% | 3.2% |
| Interquartile 25% (IQ1) | 1.2% | 2.1% |
| Interquartile 75% (IQ3) | 4.2% | 4.3% |
| Interquartile Range (IQR) | 3.1% | 2.3% |
| Standard Deviation (Sample) | 2.2% | 1.8% |
| Standard Deviation (Population) | 2.1% | 1.8% |
Similar Demographics by Professional Degree
Demographics Similar to Luxembourgers by Professional Degree
In terms of professional degree, the demographic groups most similar to Luxembourgers are Colombian (4.6%, a difference of 0.21%), Uruguayan (4.6%, a difference of 0.31%), Immigrants from South America (4.6%, a difference of 0.37%), Hungarian (4.6%, a difference of 0.44%), and Slovene (4.6%, a difference of 0.53%).
| Demographics | Rating | Rank | Professional Degree |
| South Americans | 85.6 /100 | #139 | Excellent 4.7% |
| Canadians | 84.4 /100 | #140 | Excellent 4.7% |
| Basques | 81.8 /100 | #141 | Excellent 4.6% |
| Sudanese | 81.3 /100 | #142 | Excellent 4.6% |
| Hungarians | 80.8 /100 | #143 | Excellent 4.6% |
| Immigrants | South America | 80.5 /100 | #144 | Excellent 4.6% |
| Uruguayans | 80.2 /100 | #145 | Excellent 4.6% |
| Luxembourgers | 78.7 /100 | #146 | Good 4.6% |
| Colombians | 77.7 /100 | #147 | Good 4.6% |
| Slovenes | 76.1 /100 | #148 | Good 4.6% |
| Senegalese | 75.3 /100 | #149 | Good 4.6% |
| Immigrants | Oceania | 73.4 /100 | #150 | Good 4.6% |
| Poles | 72.6 /100 | #151 | Good 4.6% |
| Immigrants | Africa | 72.5 /100 | #152 | Good 4.6% |
| Immigrants | Uruguay | 72.5 /100 | #153 | Good 4.6% |
Demographics Similar to Immigrants from Ghana by Professional Degree
In terms of professional degree, the demographic groups most similar to Immigrants from Ghana are Korean (4.1%, a difference of 0.050%), Portuguese (4.1%, a difference of 0.050%), White/Caucasian (4.1%, a difference of 0.23%), West Indian (4.1%, a difference of 0.37%), and German (4.1%, a difference of 0.41%).
| Demographics | Rating | Rank | Professional Degree |
| Sub-Saharan Africans | 12.8 /100 | #207 | Poor 4.1% |
| Immigrants | Somalia | 12.5 /100 | #208 | Poor 4.1% |
| Immigrants | Panama | 12.3 /100 | #209 | Poor 4.1% |
| Immigrants | Nigeria | 11.7 /100 | #210 | Poor 4.1% |
| Germans | 11.6 /100 | #211 | Poor 4.1% |
| Whites/Caucasians | 11.2 /100 | #212 | Poor 4.1% |
| Koreans | 10.7 /100 | #213 | Poor 4.1% |
| Immigrants | Ghana | 10.6 /100 | #214 | Poor 4.1% |
| Portuguese | 10.5 /100 | #215 | Poor 4.1% |
| West Indians | 9.8 /100 | #216 | Tragic 4.1% |
| Immigrants | Vietnam | 9.4 /100 | #217 | Tragic 4.0% |
| Dutch | 9.0 /100 | #218 | Tragic 4.0% |
| Immigrants | South Eastern Asia | 8.9 /100 | #219 | Tragic 4.0% |
| Ute | 8.2 /100 | #220 | Tragic 4.0% |
| French Canadians | 8.0 /100 | #221 | Tragic 4.0% |