Delaware vs Immigrants from Ghana Professional Degree
COMPARE
Delaware
Immigrants from Ghana
Professional Degree
Professional Degree Comparison
Delaware
Immigrants from Ghana
3.6%
PROFESSIONAL DEGREE
0.7/ 100
METRIC RATING
267th/ 347
METRIC RANK
4.1%
PROFESSIONAL DEGREE
10.6/ 100
METRIC RATING
214th/ 347
METRIC RANK
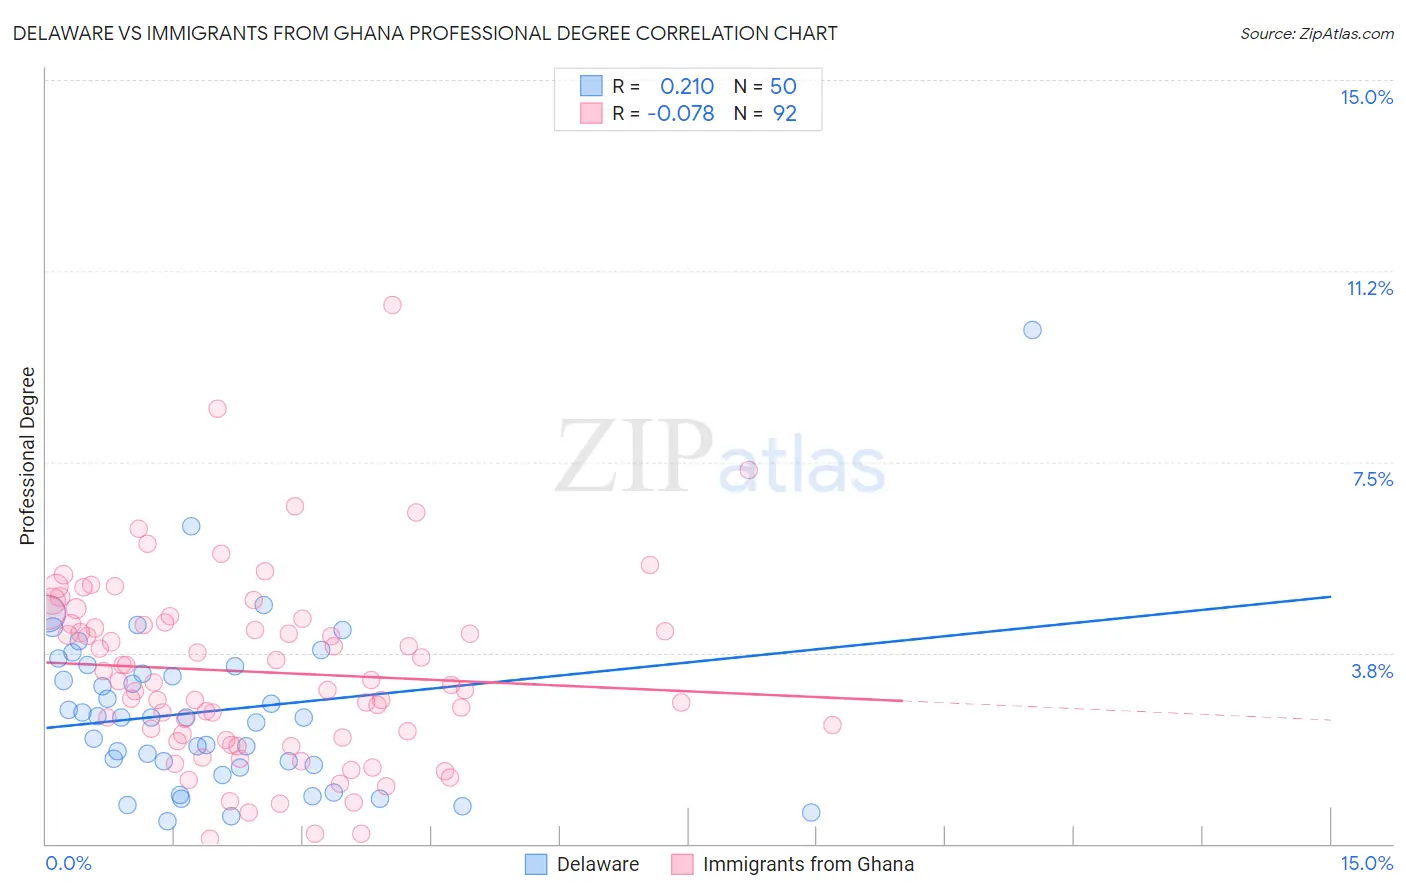
Delaware vs Immigrants from Ghana Professional Degree Correlation Chart
The statistical analysis conducted on geographies consisting of 96,092,765 people shows a weak positive correlation between the proportion of Delaware and percentage of population with at least professional degree education in the United States with a correlation coefficient (R) of 0.210 and weighted average of 3.6%. Similarly, the statistical analysis conducted on geographies consisting of 199,711,542 people shows a slight negative correlation between the proportion of Immigrants from Ghana and percentage of population with at least professional degree education in the United States with a correlation coefficient (R) of -0.078 and weighted average of 4.1%, a difference of 12.2%.
Professional Degree Correlation Summary
| Measurement | Delaware | Immigrants from Ghana |
| Minimum | 0.44% | 0.098% |
| Maximum | 10.1% | 10.6% |
| Range | 9.6% | 10.5% |
| Mean | 2.6% | 3.4% |
| Median | 2.5% | 3.2% |
| Interquartile 25% (IQ1) | 1.5% | 2.1% |
| Interquartile 75% (IQ3) | 3.5% | 4.3% |
| Interquartile Range (IQR) | 1.9% | 2.3% |
| Standard Deviation (Sample) | 1.7% | 1.8% |
| Standard Deviation (Population) | 1.7% | 1.8% |
Similar Demographics by Professional Degree
Demographics Similar to Delaware by Professional Degree
In terms of professional degree, the demographic groups most similar to Delaware are Aleut (3.6%, a difference of 0.15%), Central American Indian (3.6%, a difference of 0.26%), Immigrants from Congo (3.6%, a difference of 0.58%), Immigrants from Cambodia (3.6%, a difference of 0.63%), and Hopi (3.6%, a difference of 0.64%).
| Demographics | Rating | Rank | Professional Degree |
| Indonesians | 1.0 /100 | #260 | Tragic 3.7% |
| Immigrants | Guyana | 1.0 /100 | #261 | Tragic 3.7% |
| U.S. Virgin Islanders | 1.0 /100 | #262 | Tragic 3.7% |
| Hopi | 0.9 /100 | #263 | Tragic 3.6% |
| Immigrants | Cambodia | 0.9 /100 | #264 | Tragic 3.6% |
| Immigrants | Congo | 0.8 /100 | #265 | Tragic 3.6% |
| Central American Indians | 0.8 /100 | #266 | Tragic 3.6% |
| Delaware | 0.7 /100 | #267 | Tragic 3.6% |
| Aleuts | 0.7 /100 | #268 | Tragic 3.6% |
| Immigrants | Cuba | 0.6 /100 | #269 | Tragic 3.6% |
| Central Americans | 0.6 /100 | #270 | Tragic 3.6% |
| Belizeans | 0.5 /100 | #271 | Tragic 3.6% |
| Immigrants | Jamaica | 0.5 /100 | #272 | Tragic 3.6% |
| Americans | 0.5 /100 | #273 | Tragic 3.6% |
| Potawatomi | 0.5 /100 | #274 | Tragic 3.6% |
Demographics Similar to Immigrants from Ghana by Professional Degree
In terms of professional degree, the demographic groups most similar to Immigrants from Ghana are Korean (4.1%, a difference of 0.050%), Portuguese (4.1%, a difference of 0.050%), White/Caucasian (4.1%, a difference of 0.23%), West Indian (4.1%, a difference of 0.37%), and German (4.1%, a difference of 0.41%).
| Demographics | Rating | Rank | Professional Degree |
| Sub-Saharan Africans | 12.8 /100 | #207 | Poor 4.1% |
| Immigrants | Somalia | 12.5 /100 | #208 | Poor 4.1% |
| Immigrants | Panama | 12.3 /100 | #209 | Poor 4.1% |
| Immigrants | Nigeria | 11.7 /100 | #210 | Poor 4.1% |
| Germans | 11.6 /100 | #211 | Poor 4.1% |
| Whites/Caucasians | 11.2 /100 | #212 | Poor 4.1% |
| Koreans | 10.7 /100 | #213 | Poor 4.1% |
| Immigrants | Ghana | 10.6 /100 | #214 | Poor 4.1% |
| Portuguese | 10.5 /100 | #215 | Poor 4.1% |
| West Indians | 9.8 /100 | #216 | Tragic 4.1% |
| Immigrants | Vietnam | 9.4 /100 | #217 | Tragic 4.0% |
| Dutch | 9.0 /100 | #218 | Tragic 4.0% |
| Immigrants | South Eastern Asia | 8.9 /100 | #219 | Tragic 4.0% |
| Ute | 8.2 /100 | #220 | Tragic 4.0% |
| French Canadians | 8.0 /100 | #221 | Tragic 4.0% |