Arapaho vs Immigrants from Belarus 3rd Grade
COMPARE
Arapaho
Immigrants from Belarus
3rd Grade
3rd Grade Comparison
Arapaho
Immigrants from Belarus
98.4%
3RD GRADE
100.0/ 100
METRIC RATING
35th/ 347
METRIC RANK
97.7%
3RD GRADE
45.9/ 100
METRIC RATING
179th/ 347
METRIC RANK
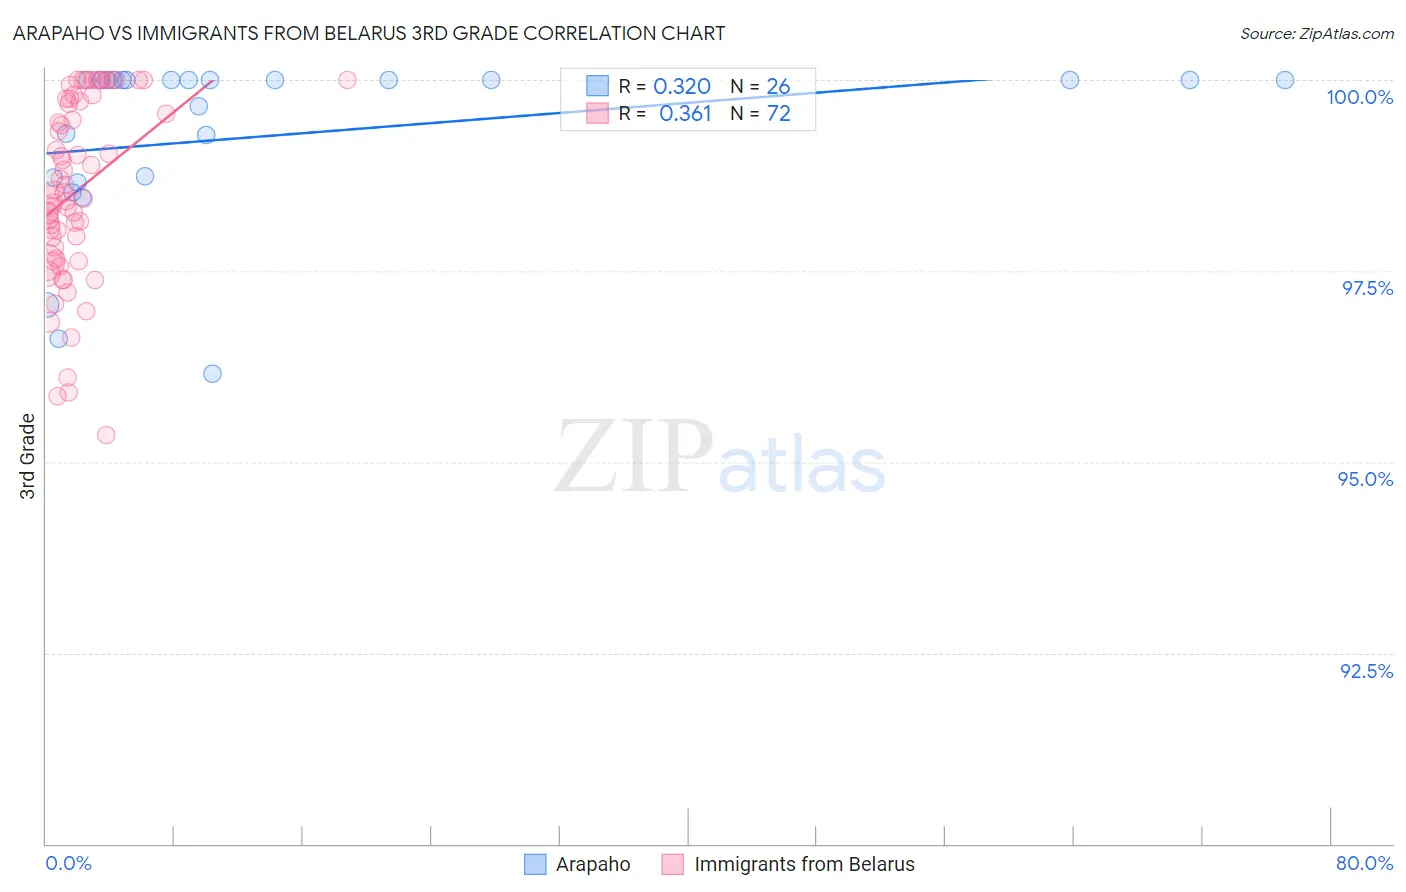
Arapaho vs Immigrants from Belarus 3rd Grade Correlation Chart
The statistical analysis conducted on geographies consisting of 29,780,295 people shows a mild positive correlation between the proportion of Arapaho and percentage of population with at least 3rd grade education in the United States with a correlation coefficient (R) of 0.320 and weighted average of 98.4%. Similarly, the statistical analysis conducted on geographies consisting of 149,993,317 people shows a mild positive correlation between the proportion of Immigrants from Belarus and percentage of population with at least 3rd grade education in the United States with a correlation coefficient (R) of 0.361 and weighted average of 97.7%, a difference of 0.66%.
3rd Grade Correlation Summary
| Measurement | Arapaho | Immigrants from Belarus |
| Minimum | 96.2% | 95.4% |
| Maximum | 100.0% | 100.0% |
| Range | 3.8% | 4.6% |
| Mean | 99.3% | 98.6% |
| Median | 100.0% | 98.5% |
| Interquartile 25% (IQ1) | 98.7% | 97.7% |
| Interquartile 75% (IQ3) | 100.0% | 99.7% |
| Interquartile Range (IQR) | 1.3% | 2.0% |
| Standard Deviation (Sample) | 1.1% | 1.2% |
| Standard Deviation (Population) | 1.1% | 1.2% |
Similar Demographics by 3rd Grade
Demographics Similar to Arapaho by 3rd Grade
In terms of 3rd grade, the demographic groups most similar to Arapaho are Swiss (98.4%, a difference of 0.010%), British (98.4%, a difference of 0.010%), Chinese (98.4%, a difference of 0.020%), Italian (98.4%, a difference of 0.020%), and Chippewa (98.4%, a difference of 0.020%).
| Demographics | Rating | Rank | 3rd Grade |
| French | 100.0 /100 | #28 | Exceptional 98.4% |
| French Canadians | 100.0 /100 | #29 | Exceptional 98.4% |
| Europeans | 100.0 /100 | #30 | Exceptional 98.4% |
| Czechs | 100.0 /100 | #31 | Exceptional 98.4% |
| Scandinavians | 100.0 /100 | #32 | Exceptional 98.4% |
| Chinese | 100.0 /100 | #33 | Exceptional 98.4% |
| Swiss | 100.0 /100 | #34 | Exceptional 98.4% |
| Arapaho | 100.0 /100 | #35 | Exceptional 98.4% |
| British | 99.9 /100 | #36 | Exceptional 98.4% |
| Italians | 99.9 /100 | #37 | Exceptional 98.4% |
| Chippewa | 99.9 /100 | #38 | Exceptional 98.4% |
| Latvians | 99.9 /100 | #39 | Exceptional 98.4% |
| Eastern Europeans | 99.9 /100 | #40 | Exceptional 98.3% |
| Luxembourgers | 99.9 /100 | #41 | Exceptional 98.3% |
| Belgians | 99.9 /100 | #42 | Exceptional 98.3% |
Demographics Similar to Immigrants from Belarus by 3rd Grade
In terms of 3rd grade, the demographic groups most similar to Immigrants from Belarus are Immigrants from Poland (97.8%, a difference of 0.0%), Egyptian (97.7%, a difference of 0.0%), Immigrants from Brazil (97.7%, a difference of 0.0%), Immigrants from Sri Lanka (97.7%, a difference of 0.0%), and Navajo (97.8%, a difference of 0.010%).
| Demographics | Rating | Rank | 3rd Grade |
| Spanish Americans | 51.8 /100 | #172 | Average 97.8% |
| Immigrants | Korea | 50.9 /100 | #173 | Average 97.8% |
| Navajo | 50.0 /100 | #174 | Average 97.8% |
| Immigrants | Micronesia | 47.6 /100 | #175 | Average 97.8% |
| Immigrants | Poland | 47.1 /100 | #176 | Average 97.8% |
| Egyptians | 46.6 /100 | #177 | Average 97.7% |
| Immigrants | Brazil | 46.4 /100 | #178 | Average 97.7% |
| Immigrants | Belarus | 45.9 /100 | #179 | Average 97.7% |
| Immigrants | Sri Lanka | 45.1 /100 | #180 | Average 97.7% |
| Immigrants | Venezuela | 44.4 /100 | #181 | Average 97.7% |
| Argentineans | 42.9 /100 | #182 | Average 97.7% |
| Arabs | 40.0 /100 | #183 | Fair 97.7% |
| Immigrants | Kazakhstan | 37.4 /100 | #184 | Fair 97.7% |
| Immigrants | Argentina | 37.0 /100 | #185 | Fair 97.7% |
| Portuguese | 36.2 /100 | #186 | Fair 97.7% |