Salvadoran vs Immigrants from Belarus 3rd Grade
COMPARE
Salvadoran
Immigrants from Belarus
3rd Grade
3rd Grade Comparison
Salvadorans
Immigrants from Belarus
95.7%
3RD GRADE
0.0/ 100
METRIC RATING
344th/ 347
METRIC RANK
97.7%
3RD GRADE
45.9/ 100
METRIC RATING
179th/ 347
METRIC RANK
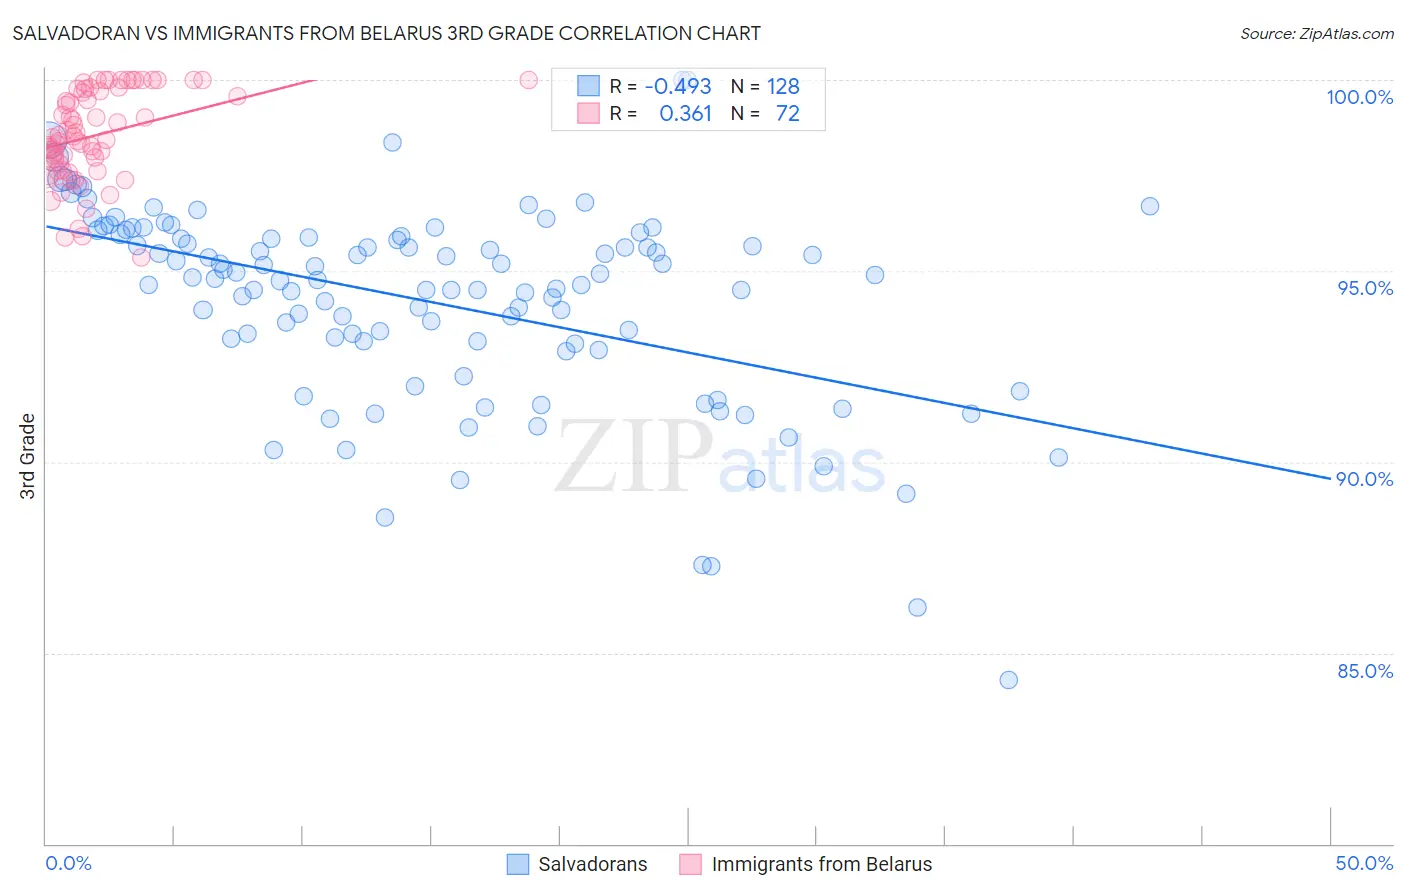
Salvadoran vs Immigrants from Belarus 3rd Grade Correlation Chart
The statistical analysis conducted on geographies consisting of 399,068,107 people shows a moderate negative correlation between the proportion of Salvadorans and percentage of population with at least 3rd grade education in the United States with a correlation coefficient (R) of -0.493 and weighted average of 95.7%. Similarly, the statistical analysis conducted on geographies consisting of 149,993,317 people shows a mild positive correlation between the proportion of Immigrants from Belarus and percentage of population with at least 3rd grade education in the United States with a correlation coefficient (R) of 0.361 and weighted average of 97.7%, a difference of 2.2%.
3rd Grade Correlation Summary
| Measurement | Salvadoran | Immigrants from Belarus |
| Minimum | 84.3% | 95.4% |
| Maximum | 100.0% | 100.0% |
| Range | 15.7% | 4.6% |
| Mean | 94.2% | 98.6% |
| Median | 94.8% | 98.5% |
| Interquartile 25% (IQ1) | 93.1% | 97.7% |
| Interquartile 75% (IQ3) | 95.9% | 99.7% |
| Interquartile Range (IQR) | 2.8% | 2.0% |
| Standard Deviation (Sample) | 2.6% | 1.2% |
| Standard Deviation (Population) | 2.6% | 1.2% |
Similar Demographics by 3rd Grade
Demographics Similar to Salvadorans by 3rd Grade
In terms of 3rd grade, the demographic groups most similar to Salvadorans are Immigrants from Mexico (95.8%, a difference of 0.11%), Immigrants from Yemen (95.6%, a difference of 0.13%), Immigrants from Central America (95.8%, a difference of 0.14%), Immigrants from Guatemala (95.8%, a difference of 0.14%), and Immigrants from El Salvador (95.5%, a difference of 0.19%).
| Demographics | Rating | Rank | 3rd Grade |
| Immigrants | Fiji | 0.0 /100 | #333 | Tragic 96.2% |
| Immigrants | Cambodia | 0.0 /100 | #334 | Tragic 96.2% |
| Immigrants | Dominican Republic | 0.0 /100 | #335 | Tragic 96.2% |
| Immigrants | Cabo Verde | 0.0 /100 | #336 | Tragic 96.2% |
| Central Americans | 0.0 /100 | #337 | Tragic 96.1% |
| Guatemalans | 0.0 /100 | #338 | Tragic 96.0% |
| Yakama | 0.0 /100 | #339 | Tragic 95.9% |
| Nepalese | 0.0 /100 | #340 | Tragic 95.9% |
| Immigrants | Central America | 0.0 /100 | #341 | Tragic 95.8% |
| Immigrants | Guatemala | 0.0 /100 | #342 | Tragic 95.8% |
| Immigrants | Mexico | 0.0 /100 | #343 | Tragic 95.8% |
| Salvadorans | 0.0 /100 | #344 | Tragic 95.7% |
| Immigrants | Yemen | 0.0 /100 | #345 | Tragic 95.6% |
| Immigrants | El Salvador | 0.0 /100 | #346 | Tragic 95.5% |
| Spanish American Indians | 0.0 /100 | #347 | Tragic 95.3% |
Demographics Similar to Immigrants from Belarus by 3rd Grade
In terms of 3rd grade, the demographic groups most similar to Immigrants from Belarus are Immigrants from Poland (97.8%, a difference of 0.0%), Egyptian (97.7%, a difference of 0.0%), Immigrants from Brazil (97.7%, a difference of 0.0%), Immigrants from Sri Lanka (97.7%, a difference of 0.0%), and Navajo (97.8%, a difference of 0.010%).
| Demographics | Rating | Rank | 3rd Grade |
| Spanish Americans | 51.8 /100 | #172 | Average 97.8% |
| Immigrants | Korea | 50.9 /100 | #173 | Average 97.8% |
| Navajo | 50.0 /100 | #174 | Average 97.8% |
| Immigrants | Micronesia | 47.6 /100 | #175 | Average 97.8% |
| Immigrants | Poland | 47.1 /100 | #176 | Average 97.8% |
| Egyptians | 46.6 /100 | #177 | Average 97.7% |
| Immigrants | Brazil | 46.4 /100 | #178 | Average 97.7% |
| Immigrants | Belarus | 45.9 /100 | #179 | Average 97.7% |
| Immigrants | Sri Lanka | 45.1 /100 | #180 | Average 97.7% |
| Immigrants | Venezuela | 44.4 /100 | #181 | Average 97.7% |
| Argentineans | 42.9 /100 | #182 | Average 97.7% |
| Arabs | 40.0 /100 | #183 | Fair 97.7% |
| Immigrants | Kazakhstan | 37.4 /100 | #184 | Fair 97.7% |
| Immigrants | Argentina | 37.0 /100 | #185 | Fair 97.7% |
| Portuguese | 36.2 /100 | #186 | Fair 97.7% |