Immigrants from Croatia vs Immigrants from Kazakhstan Bachelor's Degree
COMPARE
Immigrants from Croatia
Immigrants from Kazakhstan
Bachelor's Degree
Bachelor's Degree Comparison
Immigrants from Croatia
Immigrants from Kazakhstan
42.3%
BACHELOR'S DEGREE
99.2/ 100
METRIC RATING
80th/ 347
METRIC RANK
43.4%
BACHELOR'S DEGREE
99.8/ 100
METRIC RATING
62nd/ 347
METRIC RANK
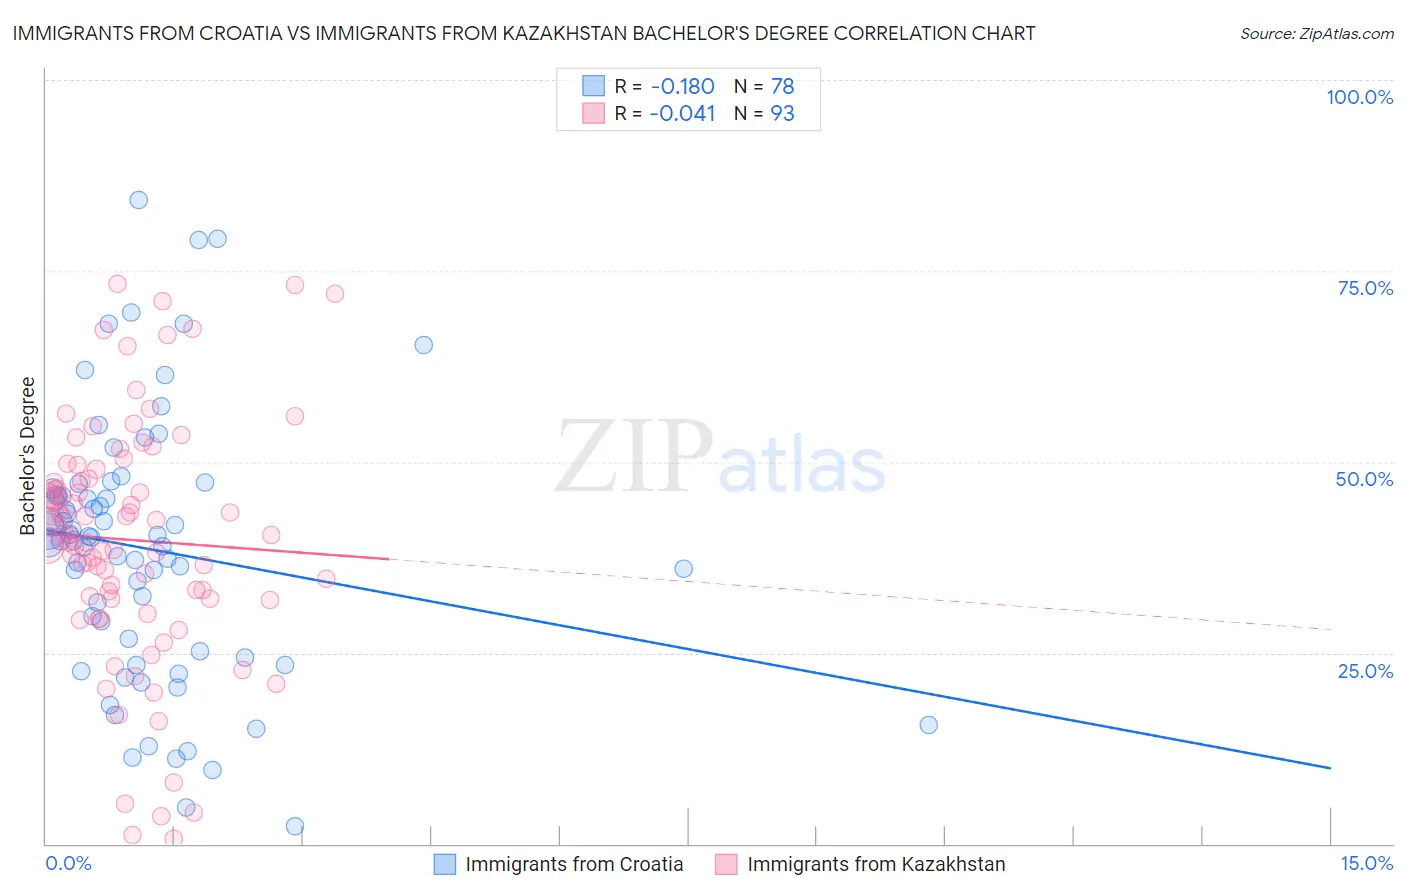
Immigrants from Croatia vs Immigrants from Kazakhstan Bachelor's Degree Correlation Chart
The statistical analysis conducted on geographies consisting of 132,578,161 people shows a poor negative correlation between the proportion of Immigrants from Croatia and percentage of population with at least bachelor's degree education in the United States with a correlation coefficient (R) of -0.180 and weighted average of 42.3%. Similarly, the statistical analysis conducted on geographies consisting of 124,444,388 people shows no correlation between the proportion of Immigrants from Kazakhstan and percentage of population with at least bachelor's degree education in the United States with a correlation coefficient (R) of -0.041 and weighted average of 43.4%, a difference of 2.6%.
Bachelor's Degree Correlation Summary
| Measurement | Immigrants from Croatia | Immigrants from Kazakhstan |
| Minimum | 2.2% | 0.64% |
| Maximum | 84.3% | 73.4% |
| Range | 82.1% | 72.8% |
| Mean | 38.6% | 39.8% |
| Median | 39.9% | 40.4% |
| Interquartile 25% (IQ1) | 25.2% | 32.1% |
| Interquartile 75% (IQ3) | 45.6% | 48.4% |
| Interquartile Range (IQR) | 20.4% | 16.4% |
| Standard Deviation (Sample) | 17.2% | 15.8% |
| Standard Deviation (Population) | 17.1% | 15.7% |
Demographics Similar to Immigrants from Croatia and Immigrants from Kazakhstan by Bachelor's Degree
In terms of bachelor's degree, the demographic groups most similar to Immigrants from Croatia are Immigrants from Hungary (42.3%, a difference of 0.020%), Immigrants from Lebanon (42.4%, a difference of 0.20%), Immigrants from Ethiopia (42.5%, a difference of 0.36%), Immigrants from Eastern Europe (42.5%, a difference of 0.43%), and Immigrants from Egypt (42.6%, a difference of 0.60%). Similarly, the demographic groups most similar to Immigrants from Kazakhstan are Immigrants from Europe (43.4%, a difference of 0.050%), South African (43.6%, a difference of 0.30%), Argentinean (43.3%, a difference of 0.32%), Zimbabwean (43.3%, a difference of 0.32%), and Immigrants from Netherlands (43.3%, a difference of 0.35%).
| Demographics | Rating | Rank | Bachelor's Degree |
| South Africans | 99.8 /100 | #61 | Exceptional 43.6% |
| Immigrants | Kazakhstan | 99.8 /100 | #62 | Exceptional 43.4% |
| Immigrants | Europe | 99.8 /100 | #63 | Exceptional 43.4% |
| Argentineans | 99.7 /100 | #64 | Exceptional 43.3% |
| Zimbabweans | 99.7 /100 | #65 | Exceptional 43.3% |
| Immigrants | Netherlands | 99.7 /100 | #66 | Exceptional 43.3% |
| Egyptians | 99.7 /100 | #67 | Exceptional 43.3% |
| Immigrants | Indonesia | 99.7 /100 | #68 | Exceptional 43.3% |
| Immigrants | Pakistan | 99.7 /100 | #69 | Exceptional 43.1% |
| Immigrants | Romania | 99.6 /100 | #70 | Exceptional 42.9% |
| Immigrants | Argentina | 99.6 /100 | #71 | Exceptional 42.8% |
| Ethiopians | 99.5 /100 | #72 | Exceptional 42.8% |
| Immigrants | Uzbekistan | 99.5 /100 | #73 | Exceptional 42.8% |
| Bhutanese | 99.5 /100 | #74 | Exceptional 42.7% |
| Immigrants | Zimbabwe | 99.4 /100 | #75 | Exceptional 42.6% |
| Immigrants | Egypt | 99.4 /100 | #76 | Exceptional 42.6% |
| Immigrants | Eastern Europe | 99.4 /100 | #77 | Exceptional 42.5% |
| Immigrants | Ethiopia | 99.4 /100 | #78 | Exceptional 42.5% |
| Immigrants | Lebanon | 99.3 /100 | #79 | Exceptional 42.4% |
| Immigrants | Croatia | 99.2 /100 | #80 | Exceptional 42.3% |
| Immigrants | Hungary | 99.2 /100 | #81 | Exceptional 42.3% |