Tsimshian vs Immigrants from Austria 1st Grade
COMPARE
Tsimshian
Immigrants from Austria
1st Grade
1st Grade Comparison
Tsimshian
Immigrants from Austria
98.8%
1ST GRADE
100.0/ 100
METRIC RATING
5th/ 347
METRIC RANK
98.3%
1ST GRADE
99.6/ 100
METRIC RATING
67th/ 347
METRIC RANK
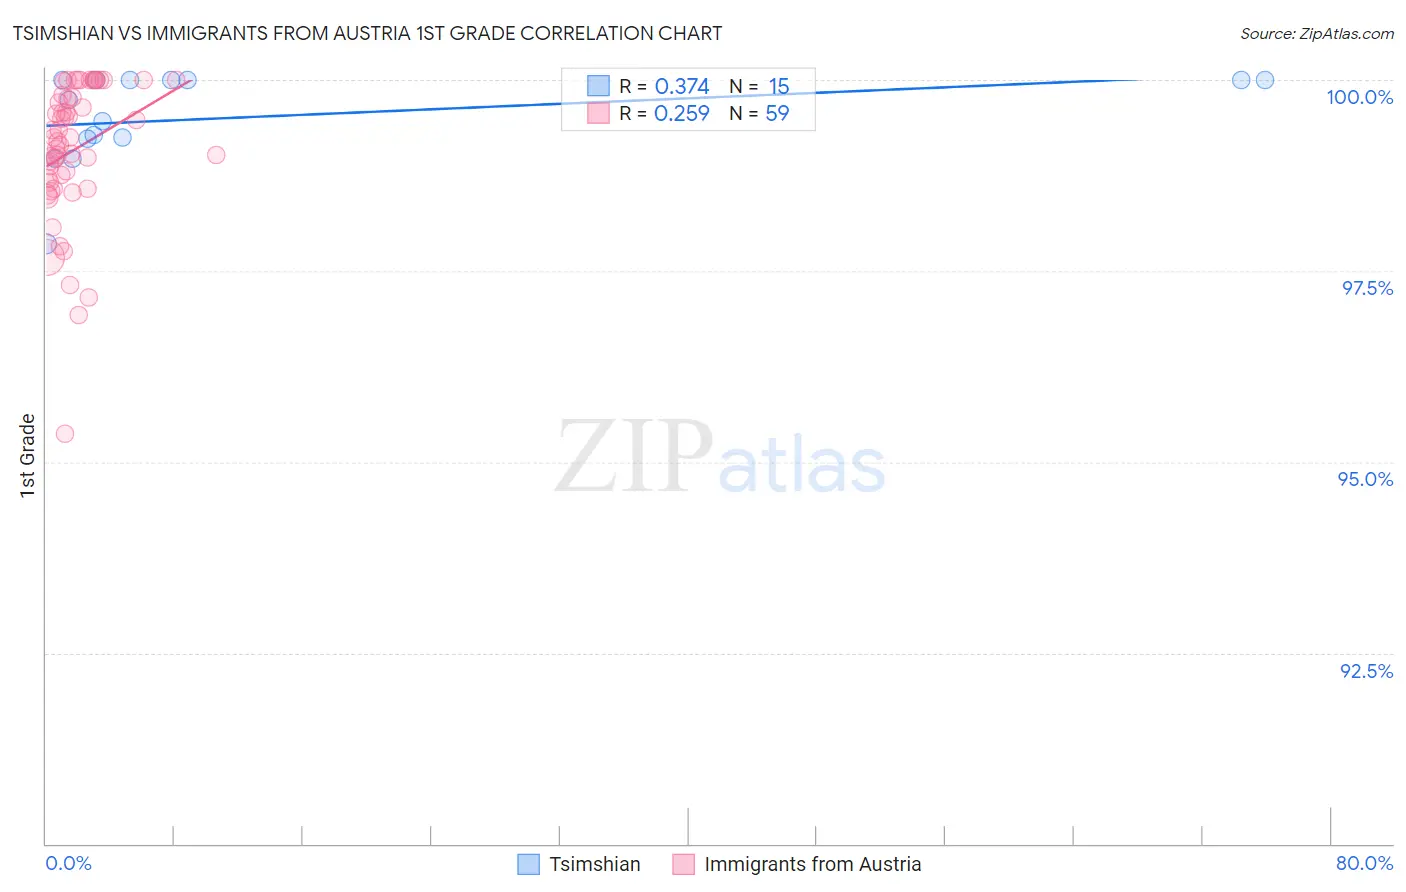
Tsimshian vs Immigrants from Austria 1st Grade Correlation Chart
The statistical analysis conducted on geographies consisting of 15,626,544 people shows a mild positive correlation between the proportion of Tsimshian and percentage of population with at least 1st grade education in the United States with a correlation coefficient (R) of 0.374 and weighted average of 98.8%. Similarly, the statistical analysis conducted on geographies consisting of 167,973,800 people shows a weak positive correlation between the proportion of Immigrants from Austria and percentage of population with at least 1st grade education in the United States with a correlation coefficient (R) of 0.259 and weighted average of 98.3%, a difference of 0.49%.
1st Grade Correlation Summary
| Measurement | Tsimshian | Immigrants from Austria |
| Minimum | 97.9% | 95.4% |
| Maximum | 100.0% | 100.0% |
| Range | 2.1% | 4.6% |
| Mean | 99.5% | 99.1% |
| Median | 99.7% | 99.2% |
| Interquartile 25% (IQ1) | 99.2% | 98.7% |
| Interquartile 75% (IQ3) | 100.0% | 99.8% |
| Interquartile Range (IQR) | 0.77% | 1.1% |
| Standard Deviation (Sample) | 0.61% | 0.92% |
| Standard Deviation (Population) | 0.59% | 0.92% |
Similar Demographics by 1st Grade
Demographics Similar to Tsimshian by 1st Grade
In terms of 1st grade, the demographic groups most similar to Tsimshian are Welsh (98.9%, a difference of 0.030%), Inupiat (98.9%, a difference of 0.040%), Alaskan Athabascan (98.8%, a difference of 0.060%), Alaska Native (98.7%, a difference of 0.10%), and Norwegian (98.7%, a difference of 0.13%).
| Demographics | Rating | Rank | 1st Grade |
| Crow | 100.0 /100 | #1 | Exceptional 99.6% |
| Yup'ik | 100.0 /100 | #2 | Exceptional 99.2% |
| Inupiat | 100.0 /100 | #3 | Exceptional 98.9% |
| Welsh | 100.0 /100 | #4 | Exceptional 98.9% |
| Tsimshian | 100.0 /100 | #5 | Exceptional 98.8% |
| Alaskan Athabascans | 100.0 /100 | #6 | Exceptional 98.8% |
| Alaska Natives | 100.0 /100 | #7 | Exceptional 98.7% |
| Norwegians | 100.0 /100 | #8 | Exceptional 98.7% |
| Slovaks | 100.0 /100 | #9 | Exceptional 98.7% |
| Germans | 100.0 /100 | #10 | Exceptional 98.7% |
| Tlingit-Haida | 100.0 /100 | #11 | Exceptional 98.7% |
| Slovenes | 100.0 /100 | #12 | Exceptional 98.7% |
| Carpatho Rusyns | 100.0 /100 | #13 | Exceptional 98.6% |
| English | 100.0 /100 | #14 | Exceptional 98.6% |
| Swedes | 100.0 /100 | #15 | Exceptional 98.6% |
Demographics Similar to Immigrants from Austria by 1st Grade
In terms of 1st grade, the demographic groups most similar to Immigrants from Austria are Canadian (98.3%, a difference of 0.0%), Immigrants from Northern Europe (98.3%, a difference of 0.0%), Chickasaw (98.3%, a difference of 0.0%), Russian (98.3%, a difference of 0.0%), and Maltese (98.4%, a difference of 0.010%).
| Demographics | Rating | Rank | 1st Grade |
| Immigrants | Canada | 99.7 /100 | #60 | Exceptional 98.4% |
| Bulgarians | 99.7 /100 | #61 | Exceptional 98.4% |
| Slavs | 99.7 /100 | #62 | Exceptional 98.4% |
| Immigrants | North America | 99.7 /100 | #63 | Exceptional 98.4% |
| Greeks | 99.7 /100 | #64 | Exceptional 98.4% |
| Maltese | 99.7 /100 | #65 | Exceptional 98.4% |
| Canadians | 99.6 /100 | #66 | Exceptional 98.3% |
| Immigrants | Austria | 99.6 /100 | #67 | Exceptional 98.3% |
| Immigrants | Northern Europe | 99.6 /100 | #68 | Exceptional 98.3% |
| Chickasaw | 99.6 /100 | #69 | Exceptional 98.3% |
| Russians | 99.6 /100 | #70 | Exceptional 98.3% |
| Serbians | 99.6 /100 | #71 | Exceptional 98.3% |
| Cheyenne | 99.6 /100 | #72 | Exceptional 98.3% |
| Cajuns | 99.5 /100 | #73 | Exceptional 98.3% |
| Immigrants | Netherlands | 99.4 /100 | #74 | Exceptional 98.3% |