Senegalese vs Immigrants from Austria 1st Grade
COMPARE
Senegalese
Immigrants from Austria
1st Grade
1st Grade Comparison
Senegalese
Immigrants from Austria
97.7%
1ST GRADE
3.5/ 100
METRIC RATING
230th/ 347
METRIC RANK
98.3%
1ST GRADE
99.6/ 100
METRIC RATING
67th/ 347
METRIC RANK
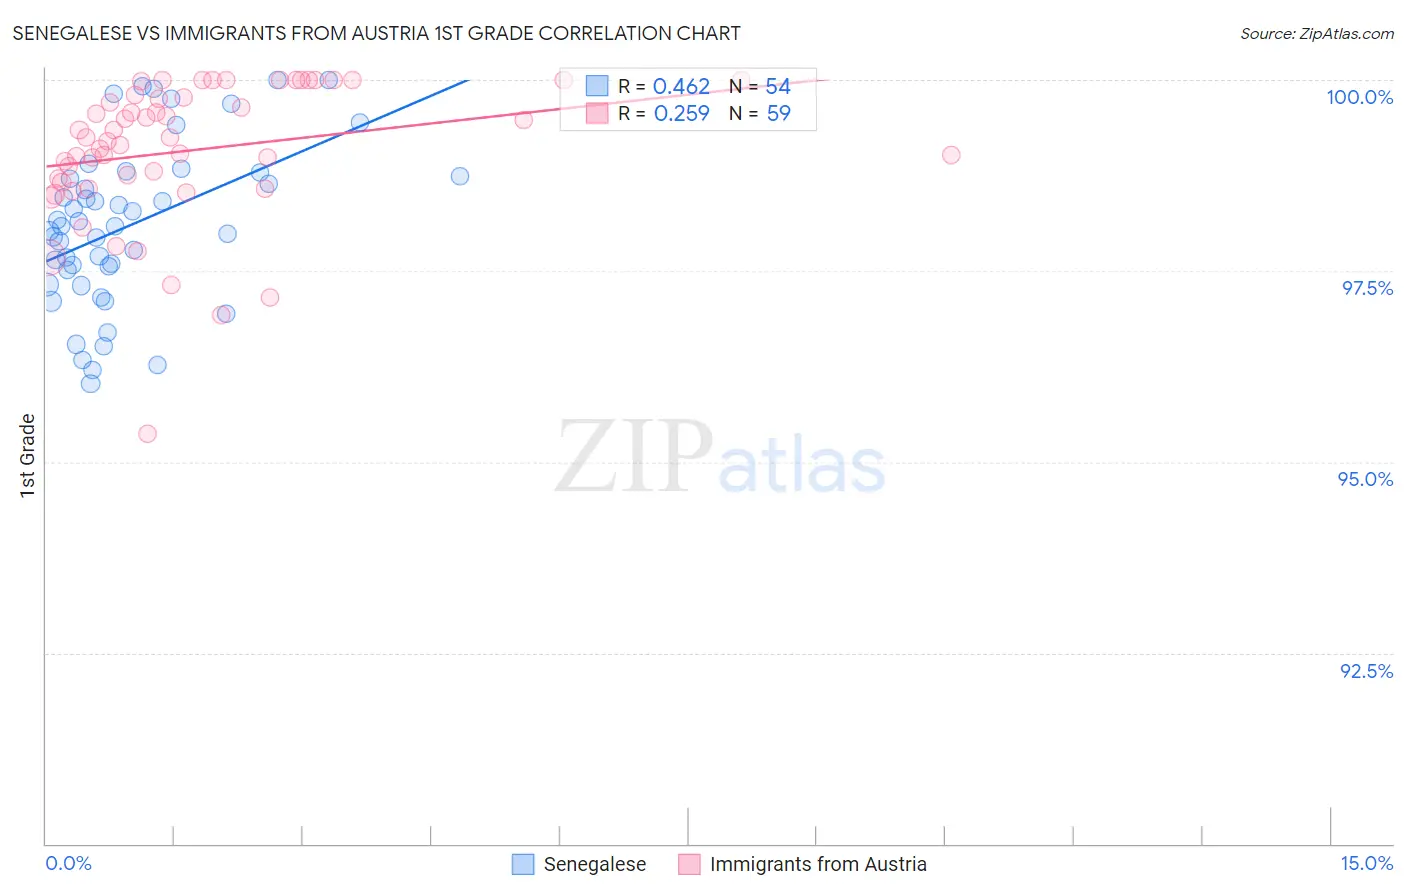
Senegalese vs Immigrants from Austria 1st Grade Correlation Chart
The statistical analysis conducted on geographies consisting of 78,142,569 people shows a moderate positive correlation between the proportion of Senegalese and percentage of population with at least 1st grade education in the United States with a correlation coefficient (R) of 0.462 and weighted average of 97.7%. Similarly, the statistical analysis conducted on geographies consisting of 167,973,800 people shows a weak positive correlation between the proportion of Immigrants from Austria and percentage of population with at least 1st grade education in the United States with a correlation coefficient (R) of 0.259 and weighted average of 98.3%, a difference of 0.70%.
1st Grade Correlation Summary
| Measurement | Senegalese | Immigrants from Austria |
| Minimum | 96.0% | 95.4% |
| Maximum | 100.0% | 100.0% |
| Range | 4.0% | 4.6% |
| Mean | 98.1% | 99.1% |
| Median | 98.1% | 99.2% |
| Interquartile 25% (IQ1) | 97.5% | 98.7% |
| Interquartile 75% (IQ3) | 98.7% | 99.8% |
| Interquartile Range (IQR) | 1.2% | 1.1% |
| Standard Deviation (Sample) | 1.0% | 0.92% |
| Standard Deviation (Population) | 1.0% | 0.92% |
Similar Demographics by 1st Grade
Demographics Similar to Senegalese by 1st Grade
In terms of 1st grade, the demographic groups most similar to Senegalese are Sierra Leonean (97.7%, a difference of 0.0%), Subsaharan African (97.7%, a difference of 0.0%), Immigrants from Costa Rica (97.7%, a difference of 0.0%), Immigrants from Zaire (97.7%, a difference of 0.010%), and Iraqi (97.7%, a difference of 0.010%).
| Demographics | Rating | Rank | 1st Grade |
| Immigrants | Zaire | 4.1 /100 | #223 | Tragic 97.7% |
| Iraqis | 4.0 /100 | #224 | Tragic 97.7% |
| Immigrants | Nepal | 4.0 /100 | #225 | Tragic 97.7% |
| Sudanese | 3.7 /100 | #226 | Tragic 97.7% |
| Sierra Leoneans | 3.6 /100 | #227 | Tragic 97.7% |
| Sub-Saharan Africans | 3.6 /100 | #228 | Tragic 97.7% |
| Immigrants | Costa Rica | 3.5 /100 | #229 | Tragic 97.7% |
| Senegalese | 3.5 /100 | #230 | Tragic 97.7% |
| Puerto Ricans | 3.0 /100 | #231 | Tragic 97.7% |
| Immigrants | Uruguay | 2.5 /100 | #232 | Tragic 97.6% |
| Immigrants | Pakistan | 2.2 /100 | #233 | Tragic 97.6% |
| Colombians | 2.2 /100 | #234 | Tragic 97.6% |
| Immigrants | Malaysia | 2.1 /100 | #235 | Tragic 97.6% |
| Immigrants | Western Asia | 2.1 /100 | #236 | Tragic 97.6% |
| U.S. Virgin Islanders | 1.9 /100 | #237 | Tragic 97.6% |
Demographics Similar to Immigrants from Austria by 1st Grade
In terms of 1st grade, the demographic groups most similar to Immigrants from Austria are Canadian (98.3%, a difference of 0.0%), Immigrants from Northern Europe (98.3%, a difference of 0.0%), Chickasaw (98.3%, a difference of 0.0%), Russian (98.3%, a difference of 0.0%), and Maltese (98.4%, a difference of 0.010%).
| Demographics | Rating | Rank | 1st Grade |
| Immigrants | Canada | 99.7 /100 | #60 | Exceptional 98.4% |
| Bulgarians | 99.7 /100 | #61 | Exceptional 98.4% |
| Slavs | 99.7 /100 | #62 | Exceptional 98.4% |
| Immigrants | North America | 99.7 /100 | #63 | Exceptional 98.4% |
| Greeks | 99.7 /100 | #64 | Exceptional 98.4% |
| Maltese | 99.7 /100 | #65 | Exceptional 98.4% |
| Canadians | 99.6 /100 | #66 | Exceptional 98.3% |
| Immigrants | Austria | 99.6 /100 | #67 | Exceptional 98.3% |
| Immigrants | Northern Europe | 99.6 /100 | #68 | Exceptional 98.3% |
| Chickasaw | 99.6 /100 | #69 | Exceptional 98.3% |
| Russians | 99.6 /100 | #70 | Exceptional 98.3% |
| Serbians | 99.6 /100 | #71 | Exceptional 98.3% |
| Cheyenne | 99.6 /100 | #72 | Exceptional 98.3% |
| Cajuns | 99.5 /100 | #73 | Exceptional 98.3% |
| Immigrants | Netherlands | 99.4 /100 | #74 | Exceptional 98.3% |