Immigrants from Mexico vs Turkish 6th Grade
COMPARE
Immigrants from Mexico
Turkish
6th Grade
6th Grade Comparison
Immigrants from Mexico
Turks
93.9%
6TH GRADE
0.0/ 100
METRIC RATING
343rd/ 347
METRIC RANK
97.5%
6TH GRADE
98.3/ 100
METRIC RATING
100th/ 347
METRIC RANK
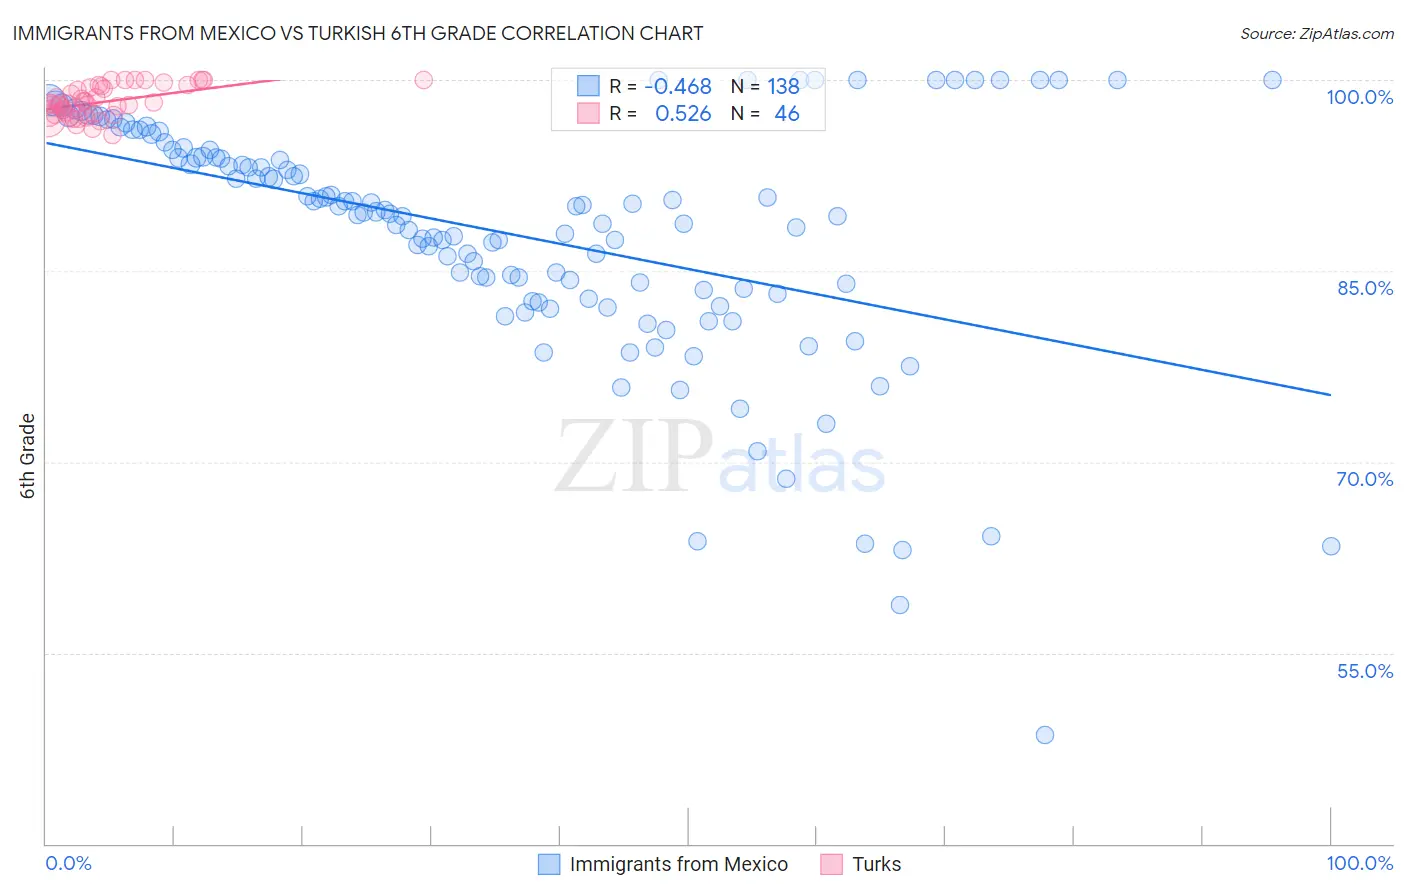
Immigrants from Mexico vs Turkish 6th Grade Correlation Chart
The statistical analysis conducted on geographies consisting of 513,767,713 people shows a moderate negative correlation between the proportion of Immigrants from Mexico and percentage of population with at least 6th grade education in the United States with a correlation coefficient (R) of -0.468 and weighted average of 93.9%. Similarly, the statistical analysis conducted on geographies consisting of 271,858,657 people shows a substantial positive correlation between the proportion of Turks and percentage of population with at least 6th grade education in the United States with a correlation coefficient (R) of 0.526 and weighted average of 97.5%, a difference of 3.8%.
6th Grade Correlation Summary
| Measurement | Immigrants from Mexico | Turkish |
| Minimum | 48.6% | 95.6% |
| Maximum | 100.0% | 100.0% |
| Range | 51.4% | 4.4% |
| Mean | 88.0% | 98.3% |
| Median | 89.6% | 98.1% |
| Interquartile 25% (IQ1) | 83.5% | 97.3% |
| Interquartile 75% (IQ3) | 94.5% | 99.5% |
| Interquartile Range (IQR) | 11.0% | 2.2% |
| Standard Deviation (Sample) | 9.5% | 1.2% |
| Standard Deviation (Population) | 9.4% | 1.2% |
Similar Demographics by 6th Grade
Demographics Similar to Immigrants from Mexico by 6th Grade
In terms of 6th grade, the demographic groups most similar to Immigrants from Mexico are Immigrants from Guatemala (93.9%, a difference of 0.0%), Salvadoran (93.9%, a difference of 0.010%), Immigrants from Central America (94.0%, a difference of 0.060%), Immigrants from Yemen (94.1%, a difference of 0.16%), and Guatemalan (94.2%, a difference of 0.28%).
| Demographics | Rating | Rank | 6th Grade |
| Immigrants | Latin America | 0.0 /100 | #333 | Tragic 94.7% |
| Immigrants | Azores | 0.0 /100 | #334 | Tragic 94.7% |
| Mexicans | 0.0 /100 | #335 | Tragic 94.6% |
| Immigrants | Dominican Republic | 0.0 /100 | #336 | Tragic 94.6% |
| Central Americans | 0.0 /100 | #337 | Tragic 94.5% |
| Immigrants | Cabo Verde | 0.0 /100 | #338 | Tragic 94.4% |
| Yakama | 0.0 /100 | #339 | Tragic 94.3% |
| Guatemalans | 0.0 /100 | #340 | Tragic 94.2% |
| Immigrants | Yemen | 0.0 /100 | #341 | Tragic 94.1% |
| Immigrants | Central America | 0.0 /100 | #342 | Tragic 94.0% |
| Immigrants | Mexico | 0.0 /100 | #343 | Tragic 93.9% |
| Immigrants | Guatemala | 0.0 /100 | #344 | Tragic 93.9% |
| Salvadorans | 0.0 /100 | #345 | Tragic 93.9% |
| Spanish American Indians | 0.0 /100 | #346 | Tragic 93.6% |
| Immigrants | El Salvador | 0.0 /100 | #347 | Tragic 93.6% |
Demographics Similar to Turks by 6th Grade
In terms of 6th grade, the demographic groups most similar to Turks are South African (97.5%, a difference of 0.0%), Immigrants from Denmark (97.5%, a difference of 0.020%), Yugoslavian (97.5%, a difference of 0.020%), Choctaw (97.5%, a difference of 0.020%), and Bhutanese (97.5%, a difference of 0.020%).
| Demographics | Rating | Rank | 6th Grade |
| Cree | 98.7 /100 | #93 | Exceptional 97.5% |
| Cypriots | 98.7 /100 | #94 | Exceptional 97.5% |
| Immigrants | Ireland | 98.7 /100 | #95 | Exceptional 97.5% |
| Immigrants | Germany | 98.6 /100 | #96 | Exceptional 97.5% |
| Immigrants | Sweden | 98.6 /100 | #97 | Exceptional 97.5% |
| Immigrants | Denmark | 98.5 /100 | #98 | Exceptional 97.5% |
| Yugoslavians | 98.5 /100 | #99 | Exceptional 97.5% |
| Turks | 98.3 /100 | #100 | Exceptional 97.5% |
| South Africans | 98.2 /100 | #101 | Exceptional 97.5% |
| Choctaw | 98.0 /100 | #102 | Exceptional 97.5% |
| Bhutanese | 98.0 /100 | #103 | Exceptional 97.5% |
| German Russians | 97.9 /100 | #104 | Exceptional 97.5% |
| Cheyenne | 97.9 /100 | #105 | Exceptional 97.5% |
| Menominee | 97.7 /100 | #106 | Exceptional 97.5% |
| Immigrants | Singapore | 97.6 /100 | #107 | Exceptional 97.5% |