U.S. Virgin Islander vs Immigrants from Uganda 1st Grade
COMPARE
U.S. Virgin Islander
Immigrants from Uganda
1st Grade
1st Grade Comparison
U.S. Virgin Islanders
Immigrants from Uganda
97.6%
1ST GRADE
1.9/ 100
METRIC RATING
237th/ 347
METRIC RANK
97.8%
1ST GRADE
18.2/ 100
METRIC RATING
204th/ 347
METRIC RANK
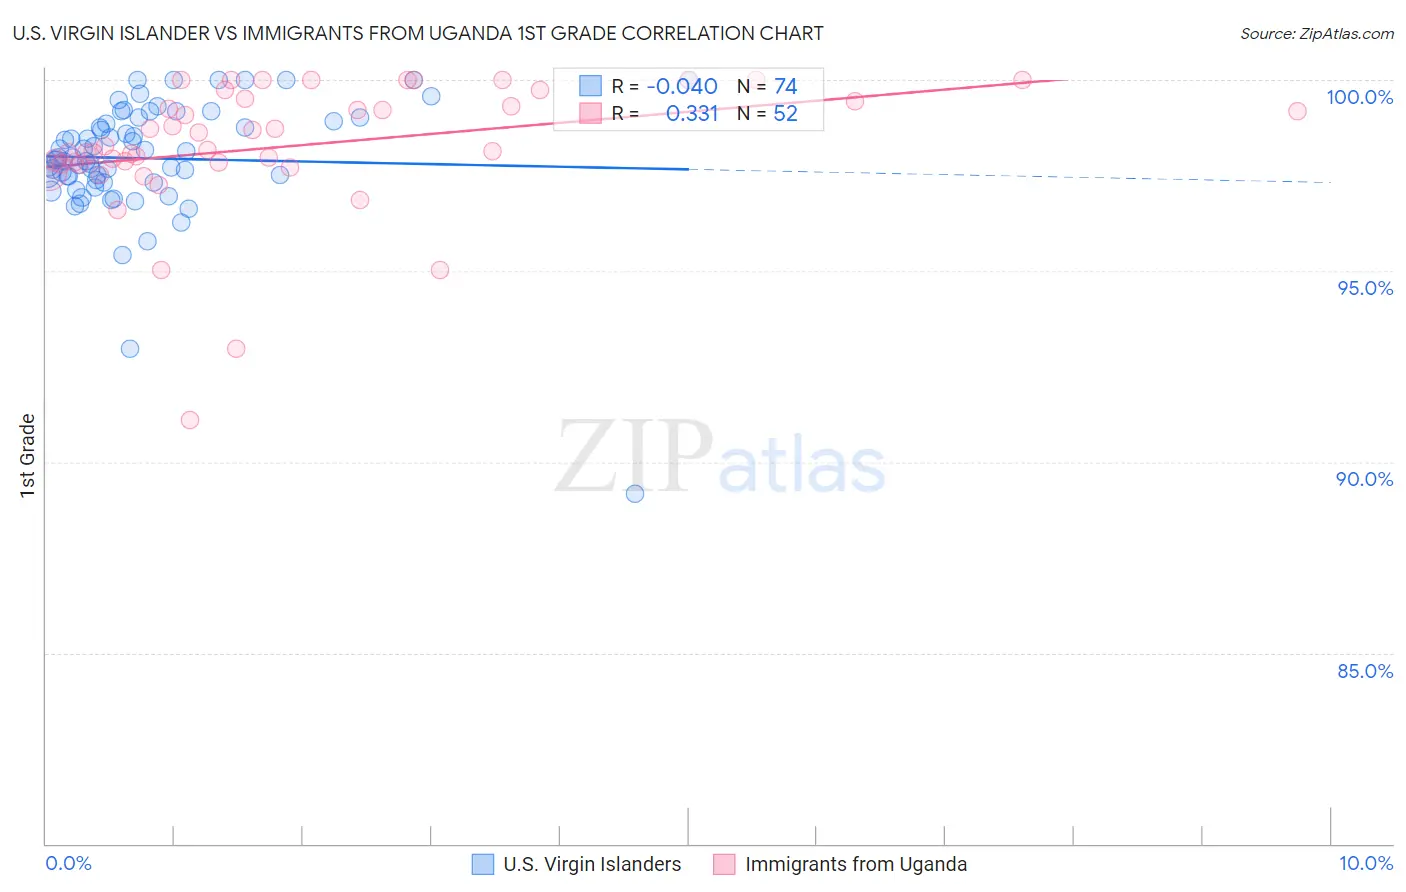
U.S. Virgin Islander vs Immigrants from Uganda 1st Grade Correlation Chart
The statistical analysis conducted on geographies consisting of 87,529,315 people shows no correlation between the proportion of U.S. Virgin Islanders and percentage of population with at least 1st grade education in the United States with a correlation coefficient (R) of -0.040 and weighted average of 97.6%. Similarly, the statistical analysis conducted on geographies consisting of 125,941,298 people shows a mild positive correlation between the proportion of Immigrants from Uganda and percentage of population with at least 1st grade education in the United States with a correlation coefficient (R) of 0.331 and weighted average of 97.8%, a difference of 0.19%.
1st Grade Correlation Summary
| Measurement | U.S. Virgin Islander | Immigrants from Uganda |
| Minimum | 89.2% | 91.1% |
| Maximum | 100.0% | 100.0% |
| Range | 10.8% | 8.9% |
| Mean | 97.9% | 98.3% |
| Median | 97.9% | 98.2% |
| Interquartile 25% (IQ1) | 97.4% | 97.8% |
| Interquartile 75% (IQ3) | 98.9% | 99.5% |
| Interquartile Range (IQR) | 1.5% | 1.6% |
| Standard Deviation (Sample) | 1.6% | 1.7% |
| Standard Deviation (Population) | 1.6% | 1.7% |
Similar Demographics by 1st Grade
Demographics Similar to U.S. Virgin Islanders by 1st Grade
In terms of 1st grade, the demographic groups most similar to U.S. Virgin Islanders are Nigerian (97.6%, a difference of 0.0%), Immigrants from Pakistan (97.6%, a difference of 0.010%), Colombian (97.6%, a difference of 0.010%), Immigrants from Malaysia (97.6%, a difference of 0.010%), and Immigrants from Western Asia (97.6%, a difference of 0.010%).
| Demographics | Rating | Rank | 1st Grade |
| Senegalese | 3.5 /100 | #230 | Tragic 97.7% |
| Puerto Ricans | 3.0 /100 | #231 | Tragic 97.7% |
| Immigrants | Uruguay | 2.5 /100 | #232 | Tragic 97.6% |
| Immigrants | Pakistan | 2.2 /100 | #233 | Tragic 97.6% |
| Colombians | 2.2 /100 | #234 | Tragic 97.6% |
| Immigrants | Malaysia | 2.1 /100 | #235 | Tragic 97.6% |
| Immigrants | Western Asia | 2.1 /100 | #236 | Tragic 97.6% |
| U.S. Virgin Islanders | 1.9 /100 | #237 | Tragic 97.6% |
| Nigerians | 1.8 /100 | #238 | Tragic 97.6% |
| Immigrants | Eastern Asia | 1.6 /100 | #239 | Tragic 97.6% |
| Koreans | 1.5 /100 | #240 | Tragic 97.6% |
| Liberians | 1.4 /100 | #241 | Tragic 97.6% |
| Immigrants | Indonesia | 1.2 /100 | #242 | Tragic 97.6% |
| Bolivians | 1.2 /100 | #243 | Tragic 97.6% |
| Asians | 1.1 /100 | #244 | Tragic 97.6% |
Demographics Similar to Immigrants from Uganda by 1st Grade
In terms of 1st grade, the demographic groups most similar to Immigrants from Uganda are Immigrants from Southern Europe (97.8%, a difference of 0.0%), Immigrants from Chile (97.8%, a difference of 0.0%), Immigrants from Albania (97.8%, a difference of 0.0%), Immigrants from Lebanon (97.8%, a difference of 0.010%), and Immigrants from Ukraine (97.8%, a difference of 0.010%).
| Demographics | Rating | Rank | 1st Grade |
| Guamanians/Chamorros | 26.2 /100 | #197 | Fair 97.8% |
| Yuman | 24.4 /100 | #198 | Fair 97.8% |
| Tohono O'odham | 23.2 /100 | #199 | Fair 97.8% |
| Immigrants | Egypt | 22.6 /100 | #200 | Fair 97.8% |
| Immigrants | Lebanon | 20.1 /100 | #201 | Fair 97.8% |
| Immigrants | Ukraine | 19.2 /100 | #202 | Poor 97.8% |
| Immigrants | Southern Europe | 18.2 /100 | #203 | Poor 97.8% |
| Immigrants | Uganda | 18.2 /100 | #204 | Poor 97.8% |
| Immigrants | Chile | 17.7 /100 | #205 | Poor 97.8% |
| Immigrants | Albania | 17.3 /100 | #206 | Poor 97.8% |
| Africans | 16.5 /100 | #207 | Poor 97.8% |
| Immigrants | Northern Africa | 12.0 /100 | #208 | Poor 97.8% |
| Costa Ricans | 11.6 /100 | #209 | Poor 97.8% |
| Immigrants | Oceania | 11.0 /100 | #210 | Poor 97.8% |
| Laotians | 10.3 /100 | #211 | Poor 97.8% |