U.S. Virgin Islander vs Immigrants from Colombia 1st Grade
COMPARE
U.S. Virgin Islander
Immigrants from Colombia
1st Grade
1st Grade Comparison
U.S. Virgin Islanders
Immigrants from Colombia
97.6%
1ST GRADE
1.9/ 100
METRIC RATING
237th/ 347
METRIC RANK
97.5%
1ST GRADE
0.6/ 100
METRIC RATING
255th/ 347
METRIC RANK
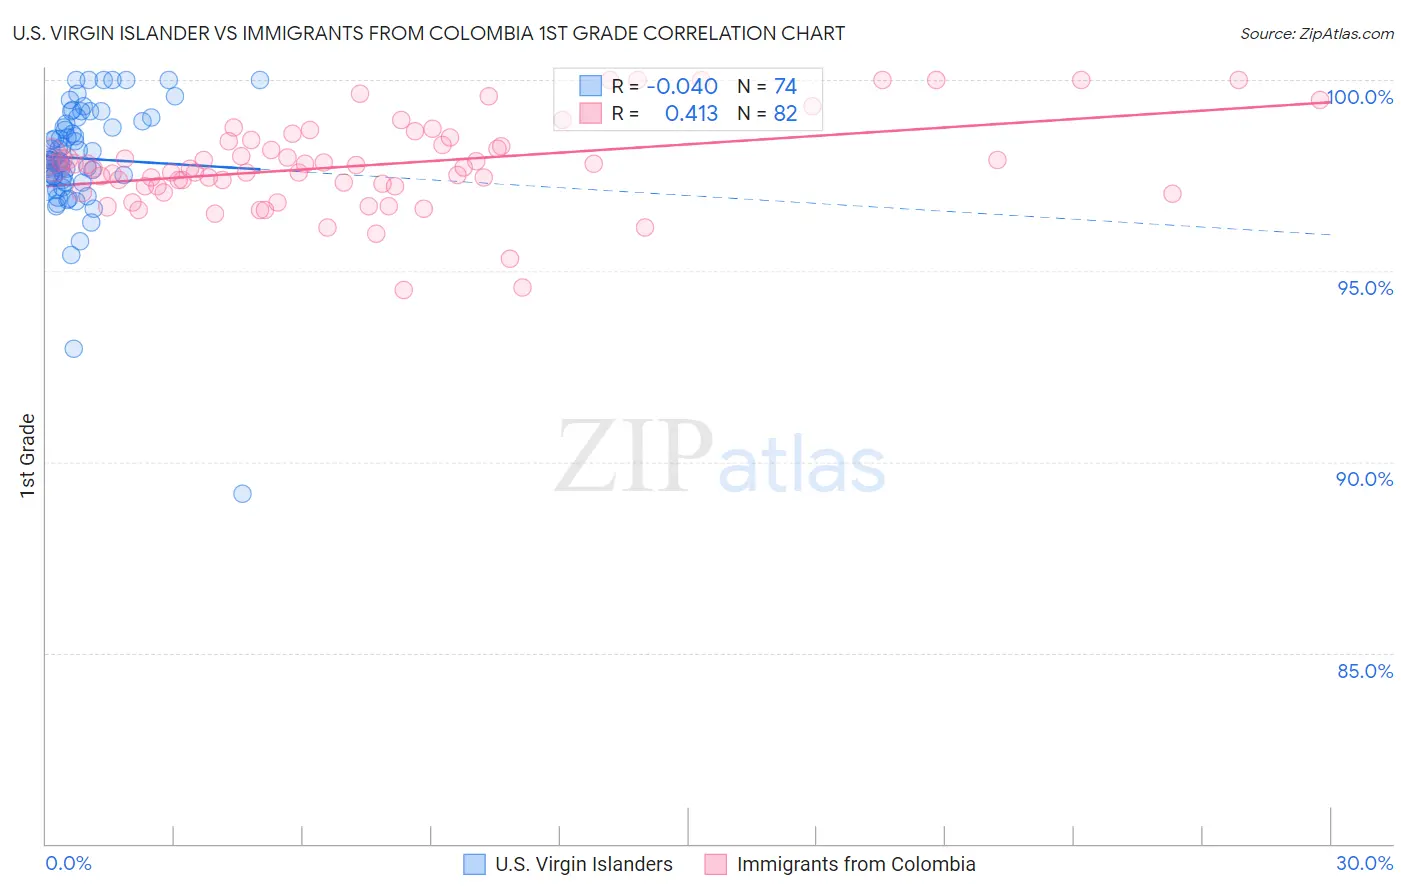
U.S. Virgin Islander vs Immigrants from Colombia 1st Grade Correlation Chart
The statistical analysis conducted on geographies consisting of 87,529,315 people shows no correlation between the proportion of U.S. Virgin Islanders and percentage of population with at least 1st grade education in the United States with a correlation coefficient (R) of -0.040 and weighted average of 97.6%. Similarly, the statistical analysis conducted on geographies consisting of 378,643,693 people shows a moderate positive correlation between the proportion of Immigrants from Colombia and percentage of population with at least 1st grade education in the United States with a correlation coefficient (R) of 0.413 and weighted average of 97.5%, a difference of 0.090%.
1st Grade Correlation Summary
| Measurement | U.S. Virgin Islander | Immigrants from Colombia |
| Minimum | 89.2% | 94.5% |
| Maximum | 100.0% | 100.0% |
| Range | 10.8% | 5.5% |
| Mean | 97.9% | 97.8% |
| Median | 97.9% | 97.7% |
| Interquartile 25% (IQ1) | 97.4% | 97.2% |
| Interquartile 75% (IQ3) | 98.9% | 98.4% |
| Interquartile Range (IQR) | 1.5% | 1.2% |
| Standard Deviation (Sample) | 1.6% | 1.2% |
| Standard Deviation (Population) | 1.6% | 1.2% |
Demographics Similar to U.S. Virgin Islanders and Immigrants from Colombia by 1st Grade
In terms of 1st grade, the demographic groups most similar to U.S. Virgin Islanders are Nigerian (97.6%, a difference of 0.0%), Immigrants from Western Asia (97.6%, a difference of 0.010%), Immigrants from Eastern Asia (97.6%, a difference of 0.010%), Korean (97.6%, a difference of 0.020%), and Liberian (97.6%, a difference of 0.020%). Similarly, the demographic groups most similar to Immigrants from Colombia are Jamaican (97.5%, a difference of 0.0%), Immigrants from Congo (97.5%, a difference of 0.010%), Immigrants from Asia (97.5%, a difference of 0.010%), Immigrants from Africa (97.6%, a difference of 0.020%), and Ethiopian (97.6%, a difference of 0.030%).
| Demographics | Rating | Rank | 1st Grade |
| Immigrants | Western Asia | 2.1 /100 | #236 | Tragic 97.6% |
| U.S. Virgin Islanders | 1.9 /100 | #237 | Tragic 97.6% |
| Nigerians | 1.8 /100 | #238 | Tragic 97.6% |
| Immigrants | Eastern Asia | 1.6 /100 | #239 | Tragic 97.6% |
| Koreans | 1.5 /100 | #240 | Tragic 97.6% |
| Liberians | 1.4 /100 | #241 | Tragic 97.6% |
| Immigrants | Indonesia | 1.2 /100 | #242 | Tragic 97.6% |
| Bolivians | 1.2 /100 | #243 | Tragic 97.6% |
| Asians | 1.1 /100 | #244 | Tragic 97.6% |
| South Americans | 1.1 /100 | #245 | Tragic 97.6% |
| Immigrants | Eastern Africa | 1.0 /100 | #246 | Tragic 97.6% |
| Peruvians | 1.0 /100 | #247 | Tragic 97.6% |
| Immigrants | Middle Africa | 1.0 /100 | #248 | Tragic 97.6% |
| Immigrants | Senegal | 1.0 /100 | #249 | Tragic 97.6% |
| Ethiopians | 0.9 /100 | #250 | Tragic 97.6% |
| Immigrants | Iraq | 0.9 /100 | #251 | Tragic 97.6% |
| Immigrants | Africa | 0.9 /100 | #252 | Tragic 97.6% |
| Immigrants | Congo | 0.7 /100 | #253 | Tragic 97.5% |
| Immigrants | Asia | 0.7 /100 | #254 | Tragic 97.5% |
| Immigrants | Colombia | 0.6 /100 | #255 | Tragic 97.5% |
| Jamaicans | 0.6 /100 | #256 | Tragic 97.5% |