U.S. Virgin Islander vs Immigrants from Burma/Myanmar 1st Grade
COMPARE
U.S. Virgin Islander
Immigrants from Burma/Myanmar
1st Grade
1st Grade Comparison
U.S. Virgin Islanders
Immigrants from Burma/Myanmar
97.6%
1ST GRADE
1.9/ 100
METRIC RATING
237th/ 347
METRIC RANK
96.8%
1ST GRADE
0.0/ 100
METRIC RATING
320th/ 347
METRIC RANK
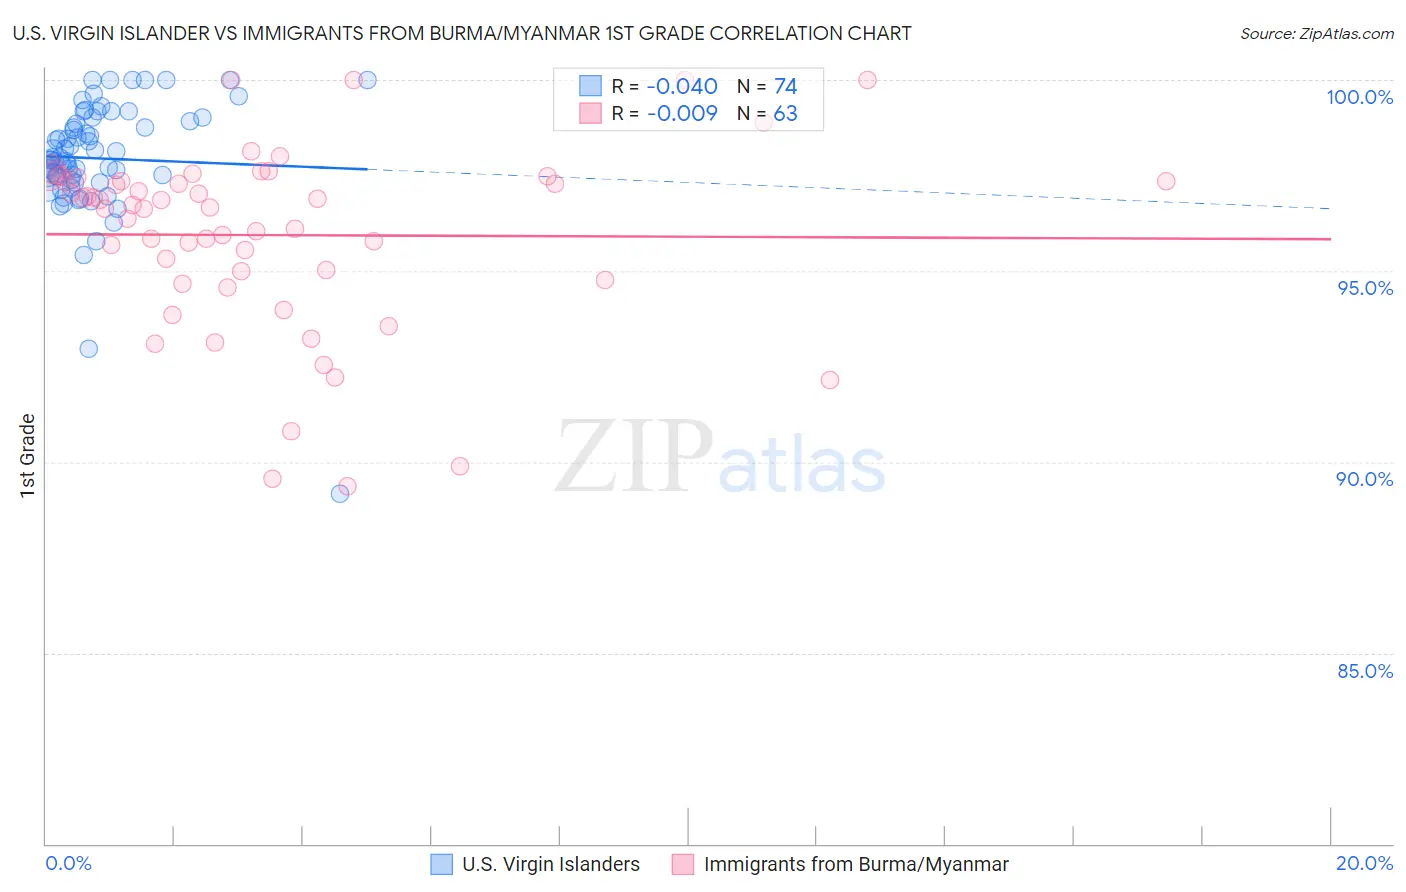
U.S. Virgin Islander vs Immigrants from Burma/Myanmar 1st Grade Correlation Chart
The statistical analysis conducted on geographies consisting of 87,529,315 people shows no correlation between the proportion of U.S. Virgin Islanders and percentage of population with at least 1st grade education in the United States with a correlation coefficient (R) of -0.040 and weighted average of 97.6%. Similarly, the statistical analysis conducted on geographies consisting of 172,338,093 people shows no correlation between the proportion of Immigrants from Burma/Myanmar and percentage of population with at least 1st grade education in the United States with a correlation coefficient (R) of -0.009 and weighted average of 96.8%, a difference of 0.85%.
1st Grade Correlation Summary
| Measurement | U.S. Virgin Islander | Immigrants from Burma/Myanmar |
| Minimum | 89.2% | 89.4% |
| Maximum | 100.0% | 100.0% |
| Range | 10.8% | 10.6% |
| Mean | 97.9% | 95.9% |
| Median | 97.9% | 96.6% |
| Interquartile 25% (IQ1) | 97.4% | 94.8% |
| Interquartile 75% (IQ3) | 98.9% | 97.4% |
| Interquartile Range (IQR) | 1.5% | 2.6% |
| Standard Deviation (Sample) | 1.6% | 2.4% |
| Standard Deviation (Population) | 1.6% | 2.4% |
Similar Demographics by 1st Grade
Demographics Similar to U.S. Virgin Islanders by 1st Grade
In terms of 1st grade, the demographic groups most similar to U.S. Virgin Islanders are Nigerian (97.6%, a difference of 0.0%), Immigrants from Pakistan (97.6%, a difference of 0.010%), Colombian (97.6%, a difference of 0.010%), Immigrants from Malaysia (97.6%, a difference of 0.010%), and Immigrants from Western Asia (97.6%, a difference of 0.010%).
| Demographics | Rating | Rank | 1st Grade |
| Senegalese | 3.5 /100 | #230 | Tragic 97.7% |
| Puerto Ricans | 3.0 /100 | #231 | Tragic 97.7% |
| Immigrants | Uruguay | 2.5 /100 | #232 | Tragic 97.6% |
| Immigrants | Pakistan | 2.2 /100 | #233 | Tragic 97.6% |
| Colombians | 2.2 /100 | #234 | Tragic 97.6% |
| Immigrants | Malaysia | 2.1 /100 | #235 | Tragic 97.6% |
| Immigrants | Western Asia | 2.1 /100 | #236 | Tragic 97.6% |
| U.S. Virgin Islanders | 1.9 /100 | #237 | Tragic 97.6% |
| Nigerians | 1.8 /100 | #238 | Tragic 97.6% |
| Immigrants | Eastern Asia | 1.6 /100 | #239 | Tragic 97.6% |
| Koreans | 1.5 /100 | #240 | Tragic 97.6% |
| Liberians | 1.4 /100 | #241 | Tragic 97.6% |
| Immigrants | Indonesia | 1.2 /100 | #242 | Tragic 97.6% |
| Bolivians | 1.2 /100 | #243 | Tragic 97.6% |
| Asians | 1.1 /100 | #244 | Tragic 97.6% |
Demographics Similar to Immigrants from Burma/Myanmar by 1st Grade
In terms of 1st grade, the demographic groups most similar to Immigrants from Burma/Myanmar are Immigrants from Guyana (96.8%, a difference of 0.0%), Immigrants from Bangladesh (96.8%, a difference of 0.010%), Immigrants from Laos (96.8%, a difference of 0.020%), Mexican American Indian (96.8%, a difference of 0.020%), and Immigrants from Honduras (96.8%, a difference of 0.030%).
| Demographics | Rating | Rank | 1st Grade |
| Guyanese | 0.0 /100 | #313 | Tragic 96.9% |
| Hondurans | 0.0 /100 | #314 | Tragic 96.9% |
| Immigrants | Belize | 0.0 /100 | #315 | Tragic 96.9% |
| Immigrants | Ecuador | 0.0 /100 | #316 | Tragic 96.9% |
| Immigrants | Nicaragua | 0.0 /100 | #317 | Tragic 96.9% |
| Immigrants | Laos | 0.0 /100 | #318 | Tragic 96.8% |
| Immigrants | Guyana | 0.0 /100 | #319 | Tragic 96.8% |
| Immigrants | Burma/Myanmar | 0.0 /100 | #320 | Tragic 96.8% |
| Immigrants | Bangladesh | 0.0 /100 | #321 | Tragic 96.8% |
| Mexican American Indians | 0.0 /100 | #322 | Tragic 96.8% |
| Immigrants | Honduras | 0.0 /100 | #323 | Tragic 96.8% |
| Vietnamese | 0.0 /100 | #324 | Tragic 96.8% |
| Dominicans | 0.0 /100 | #325 | Tragic 96.7% |
| Indonesians | 0.0 /100 | #326 | Tragic 96.7% |
| Mexicans | 0.0 /100 | #327 | Tragic 96.7% |