Immigrants from India vs Hispanic or Latino Nursery School
COMPARE
Immigrants from India
Hispanic or Latino
Nursery School
Nursery School Comparison
Immigrants from India
Hispanics or Latinos
98.3%
NURSERY SCHOOL
98.7/ 100
METRIC RATING
93rd/ 347
METRIC RANK
97.0%
NURSERY SCHOOL
0.0/ 100
METRIC RATING
307th/ 347
METRIC RANK
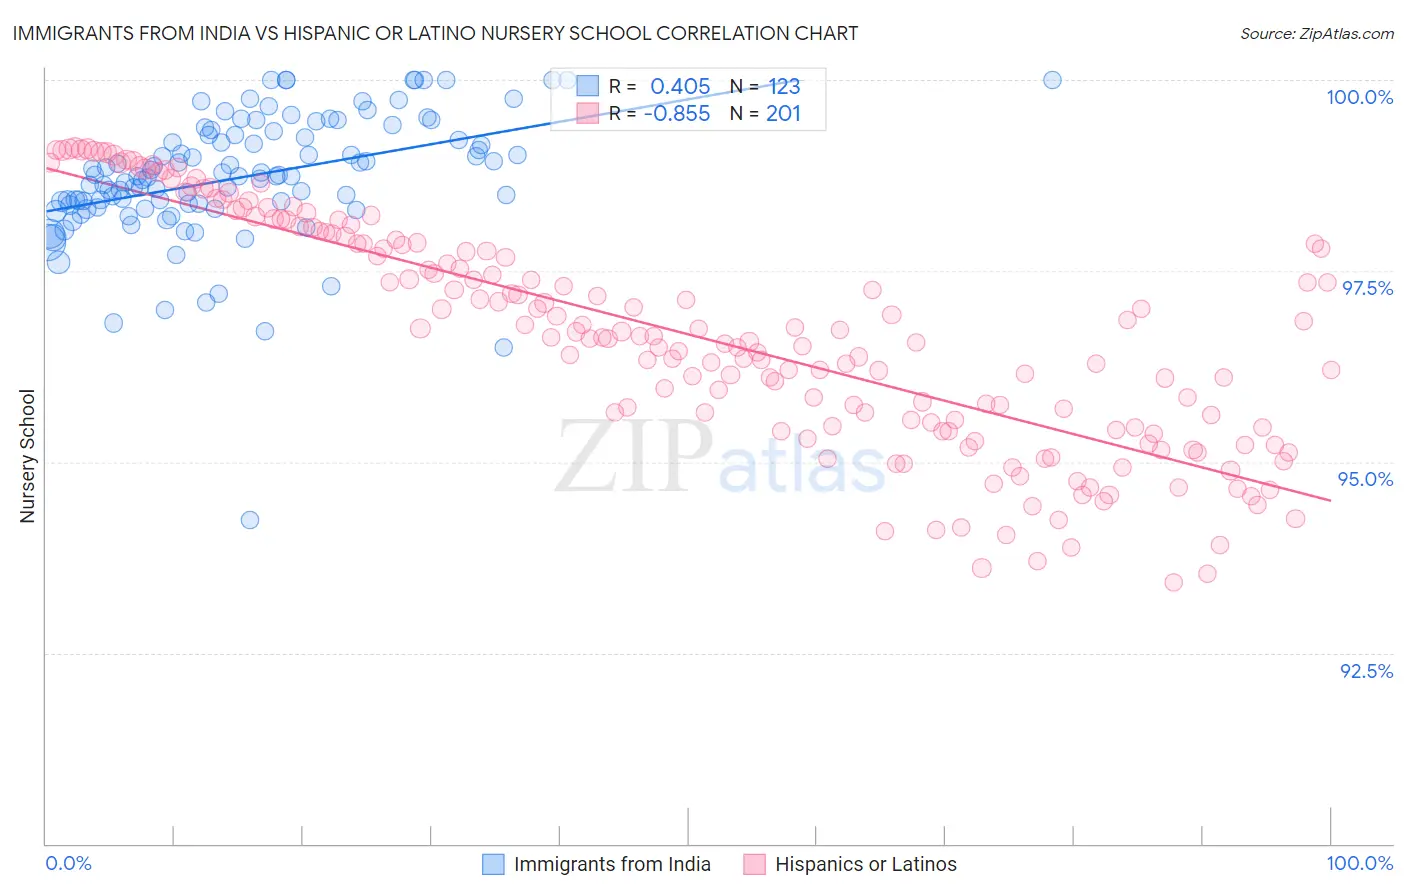
Immigrants from India vs Hispanic or Latino Nursery School Correlation Chart
The statistical analysis conducted on geographies consisting of 434,105,844 people shows a moderate positive correlation between the proportion of Immigrants from India and percentage of population with at least nursery school education in the United States with a correlation coefficient (R) of 0.405 and weighted average of 98.3%. Similarly, the statistical analysis conducted on geographies consisting of 578,615,396 people shows a very strong negative correlation between the proportion of Hispanics or Latinos and percentage of population with at least nursery school education in the United States with a correlation coefficient (R) of -0.855 and weighted average of 97.0%, a difference of 1.3%.
Nursery School Correlation Summary
| Measurement | Immigrants from India | Hispanic or Latino |
| Minimum | 94.2% | 93.4% |
| Maximum | 100.0% | 99.1% |
| Range | 5.8% | 5.7% |
| Mean | 98.7% | 96.7% |
| Median | 98.7% | 96.6% |
| Interquartile 25% (IQ1) | 98.4% | 95.4% |
| Interquartile 75% (IQ3) | 99.3% | 97.9% |
| Interquartile Range (IQR) | 0.92% | 2.4% |
| Standard Deviation (Sample) | 0.85% | 1.5% |
| Standard Deviation (Population) | 0.84% | 1.5% |
Similar Demographics by Nursery School
Demographics Similar to Immigrants from India by Nursery School
In terms of nursery school, the demographic groups most similar to Immigrants from India are Macedonian (98.3%, a difference of 0.0%), Hopi (98.3%, a difference of 0.010%), Ukrainian (98.3%, a difference of 0.010%), Immigrants from South Africa (98.3%, a difference of 0.010%), and Immigrants from Western Europe (98.3%, a difference of 0.010%).
| Demographics | Rating | Rank | Nursery School |
| Immigrants | Australia | 99.0 /100 | #86 | Exceptional 98.3% |
| Hopi | 98.9 /100 | #87 | Exceptional 98.3% |
| Ukrainians | 98.9 /100 | #88 | Exceptional 98.3% |
| Immigrants | South Africa | 98.8 /100 | #89 | Exceptional 98.3% |
| Immigrants | Western Europe | 98.8 /100 | #90 | Exceptional 98.3% |
| Zimbabweans | 98.8 /100 | #91 | Exceptional 98.3% |
| Macedonians | 98.7 /100 | #92 | Exceptional 98.3% |
| Immigrants | India | 98.7 /100 | #93 | Exceptional 98.3% |
| Immigrants | Germany | 98.6 /100 | #94 | Exceptional 98.3% |
| South Africans | 98.6 /100 | #95 | Exceptional 98.3% |
| Cypriots | 98.3 /100 | #96 | Exceptional 98.3% |
| Immigrants | Nonimmigrants | 98.3 /100 | #97 | Exceptional 98.3% |
| Choctaw | 98.3 /100 | #98 | Exceptional 98.3% |
| Colville | 98.2 /100 | #99 | Exceptional 98.3% |
| Puget Sound Salish | 98.0 /100 | #100 | Exceptional 98.3% |
Demographics Similar to Hispanics or Latinos by Nursery School
In terms of nursery school, the demographic groups most similar to Hispanics or Latinos are Immigrants from Haiti (97.0%, a difference of 0.0%), Belizean (97.0%, a difference of 0.010%), Immigrants from Somalia (97.0%, a difference of 0.010%), Guyanese (97.0%, a difference of 0.030%), and Immigrants from the Azores (97.0%, a difference of 0.030%).
| Demographics | Rating | Rank | Nursery School |
| Haitians | 0.0 /100 | #300 | Tragic 97.2% |
| Immigrants | South Eastern Asia | 0.0 /100 | #301 | Tragic 97.1% |
| Immigrants | Caribbean | 0.0 /100 | #302 | Tragic 97.1% |
| Nicaraguans | 0.0 /100 | #303 | Tragic 97.1% |
| Ecuadorians | 0.0 /100 | #304 | Tragic 97.1% |
| Somalis | 0.0 /100 | #305 | Tragic 97.1% |
| Belizeans | 0.0 /100 | #306 | Tragic 97.0% |
| Hispanics or Latinos | 0.0 /100 | #307 | Tragic 97.0% |
| Immigrants | Haiti | 0.0 /100 | #308 | Tragic 97.0% |
| Immigrants | Somalia | 0.0 /100 | #309 | Tragic 97.0% |
| Guyanese | 0.0 /100 | #310 | Tragic 97.0% |
| Immigrants | Azores | 0.0 /100 | #311 | Tragic 97.0% |
| Sri Lankans | 0.0 /100 | #312 | Tragic 97.0% |
| Hondurans | 0.0 /100 | #313 | Tragic 97.0% |
| Cape Verdeans | 0.0 /100 | #314 | Tragic 97.0% |