U.S. Virgin Islander vs Spanish Kindergarten
COMPARE
U.S. Virgin Islander
Spanish
Kindergarten
Kindergarten Comparison
U.S. Virgin Islanders
Spanish
97.6%
KINDERGARTEN
1.7/ 100
METRIC RATING
239th/ 347
METRIC RANK
98.2%
KINDERGARTEN
95.8/ 100
METRIC RATING
116th/ 347
METRIC RANK
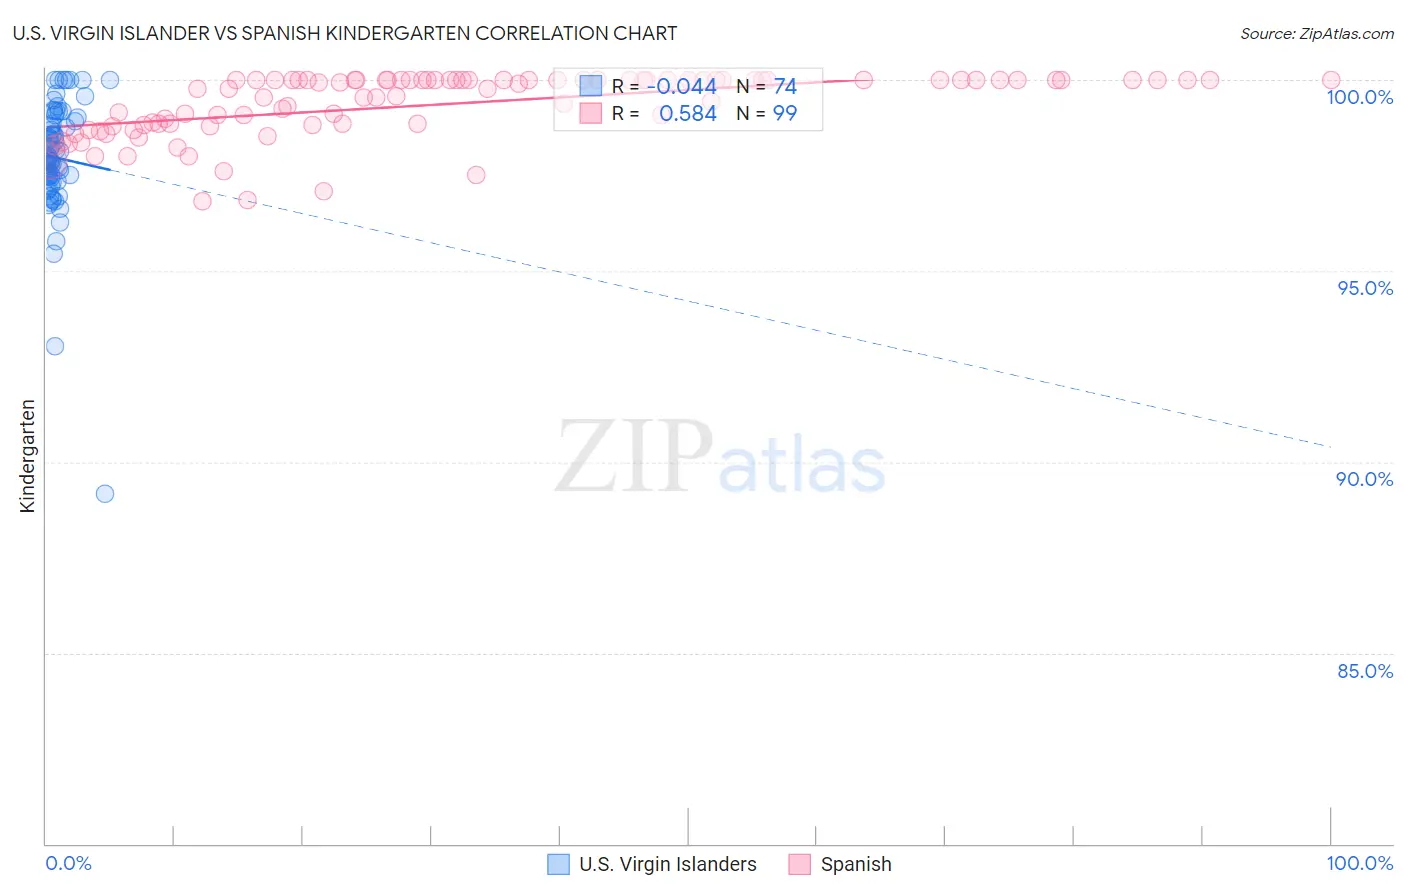
U.S. Virgin Islander vs Spanish Kindergarten Correlation Chart
The statistical analysis conducted on geographies consisting of 87,529,315 people shows no correlation between the proportion of U.S. Virgin Islanders and percentage of population with at least kindergarten education in the United States with a correlation coefficient (R) of -0.044 and weighted average of 97.6%. Similarly, the statistical analysis conducted on geographies consisting of 422,189,210 people shows a substantial positive correlation between the proportion of Spanish and percentage of population with at least kindergarten education in the United States with a correlation coefficient (R) of 0.584 and weighted average of 98.2%, a difference of 0.55%.
Kindergarten Correlation Summary
| Measurement | U.S. Virgin Islander | Spanish |
| Minimum | 89.2% | 96.8% |
| Maximum | 100.0% | 100.0% |
| Range | 10.8% | 3.2% |
| Mean | 98.0% | 99.4% |
| Median | 98.0% | 99.9% |
| Interquartile 25% (IQ1) | 97.5% | 98.8% |
| Interquartile 75% (IQ3) | 98.9% | 100.0% |
| Interquartile Range (IQR) | 1.5% | 1.2% |
| Standard Deviation (Sample) | 1.6% | 0.82% |
| Standard Deviation (Population) | 1.6% | 0.81% |
Similar Demographics by Kindergarten
Demographics Similar to U.S. Virgin Islanders by Kindergarten
In terms of kindergarten, the demographic groups most similar to U.S. Virgin Islanders are Nigerian (97.6%, a difference of 0.0%), Immigrants from Eastern Asia (97.6%, a difference of 0.0%), Korean (97.6%, a difference of 0.010%), Immigrants from Pakistan (97.7%, a difference of 0.020%), and Immigrants from Malaysia (97.7%, a difference of 0.020%).
| Demographics | Rating | Rank | Kindergarten |
| Immigrants | Uruguay | 2.6 /100 | #232 | Tragic 97.7% |
| Immigrants | Pakistan | 2.2 /100 | #233 | Tragic 97.7% |
| Immigrants | Malaysia | 2.2 /100 | #234 | Tragic 97.7% |
| Colombians | 2.2 /100 | #235 | Tragic 97.7% |
| Immigrants | Western Asia | 2.1 /100 | #236 | Tragic 97.7% |
| Nigerians | 1.8 /100 | #237 | Tragic 97.6% |
| Immigrants | Eastern Asia | 1.7 /100 | #238 | Tragic 97.6% |
| U.S. Virgin Islanders | 1.7 /100 | #239 | Tragic 97.6% |
| Koreans | 1.6 /100 | #240 | Tragic 97.6% |
| Liberians | 1.3 /100 | #241 | Tragic 97.6% |
| Immigrants | Indonesia | 1.3 /100 | #242 | Tragic 97.6% |
| Asians | 1.2 /100 | #243 | Tragic 97.6% |
| Bolivians | 1.2 /100 | #244 | Tragic 97.6% |
| South Americans | 1.1 /100 | #245 | Tragic 97.6% |
| Indians (Asian) | 1.0 /100 | #246 | Tragic 97.6% |
Demographics Similar to Spanish by Kindergarten
In terms of kindergarten, the demographic groups most similar to Spanish are Immigrants from Latvia (98.2%, a difference of 0.010%), Ute (98.2%, a difference of 0.010%), Iranian (98.2%, a difference of 0.010%), Immigrants from France (98.2%, a difference of 0.010%), and Yugoslavian (98.2%, a difference of 0.010%).
| Demographics | Rating | Rank | Kindergarten |
| German Russians | 97.1 /100 | #109 | Exceptional 98.2% |
| Immigrants | Singapore | 96.8 /100 | #110 | Exceptional 98.2% |
| Immigrants | Norway | 96.6 /100 | #111 | Exceptional 98.2% |
| Immigrants | Czechoslovakia | 96.6 /100 | #112 | Exceptional 98.2% |
| Immigrants | Latvia | 96.3 /100 | #113 | Exceptional 98.2% |
| Ute | 96.3 /100 | #114 | Exceptional 98.2% |
| Iranians | 96.2 /100 | #115 | Exceptional 98.2% |
| Spanish | 95.8 /100 | #116 | Exceptional 98.2% |
| Immigrants | France | 95.5 /100 | #117 | Exceptional 98.2% |
| Yugoslavians | 95.5 /100 | #118 | Exceptional 98.2% |
| Thais | 94.8 /100 | #119 | Exceptional 98.2% |
| Okinawans | 94.4 /100 | #120 | Exceptional 98.2% |
| Immigrants | Zimbabwe | 94.0 /100 | #121 | Exceptional 98.2% |
| Immigrants | Japan | 94.0 /100 | #122 | Exceptional 98.2% |
| Menominee | 93.9 /100 | #123 | Exceptional 98.2% |