Immigrants from Argentina vs Armenian Kindergarten
COMPARE
Immigrants from Argentina
Armenian
Kindergarten
Kindergarten Comparison
Immigrants from Argentina
Armenians
97.9%
KINDERGARTEN
40.7/ 100
METRIC RATING
184th/ 347
METRIC RANK
97.6%
KINDERGARTEN
0.5/ 100
METRIC RATING
259th/ 347
METRIC RANK
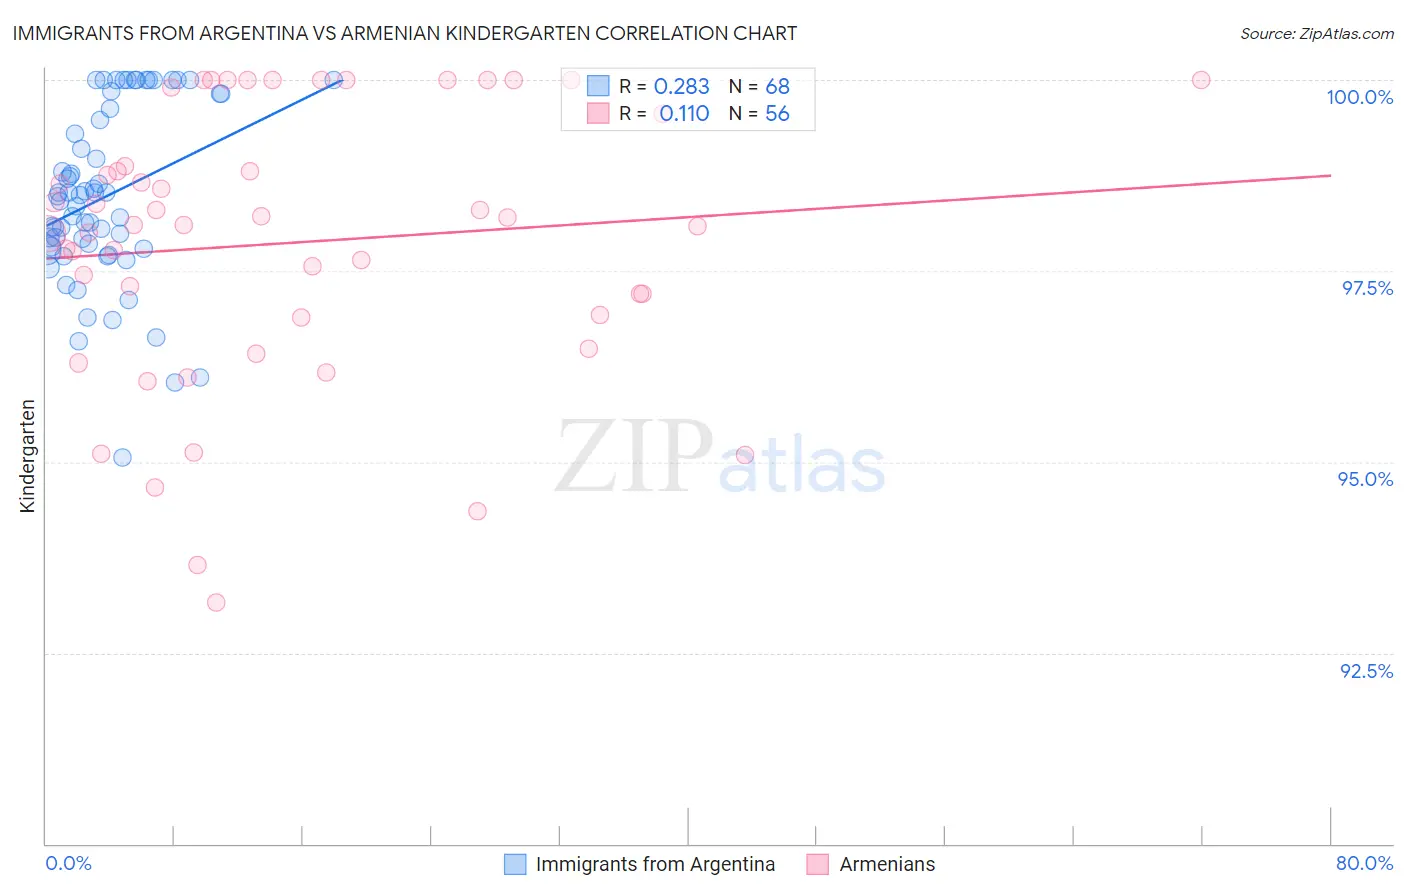
Immigrants from Argentina vs Armenian Kindergarten Correlation Chart
The statistical analysis conducted on geographies consisting of 264,435,492 people shows a weak positive correlation between the proportion of Immigrants from Argentina and percentage of population with at least kindergarten education in the United States with a correlation coefficient (R) of 0.283 and weighted average of 97.9%. Similarly, the statistical analysis conducted on geographies consisting of 310,954,660 people shows a poor positive correlation between the proportion of Armenians and percentage of population with at least kindergarten education in the United States with a correlation coefficient (R) of 0.110 and weighted average of 97.6%, a difference of 0.38%.
Kindergarten Correlation Summary
| Measurement | Immigrants from Argentina | Armenian |
| Minimum | 95.1% | 93.2% |
| Maximum | 100.0% | 100.0% |
| Range | 4.9% | 6.8% |
| Mean | 98.5% | 97.9% |
| Median | 98.5% | 98.1% |
| Interquartile 25% (IQ1) | 97.8% | 96.9% |
| Interquartile 75% (IQ3) | 99.7% | 99.2% |
| Interquartile Range (IQR) | 1.9% | 2.3% |
| Standard Deviation (Sample) | 1.2% | 1.8% |
| Standard Deviation (Population) | 1.1% | 1.8% |
Similar Demographics by Kindergarten
Demographics Similar to Immigrants from Argentina by Kindergarten
In terms of kindergarten, the demographic groups most similar to Immigrants from Argentina are Immigrants from Poland (97.9%, a difference of 0.0%), Immigrants from Belarus (97.9%, a difference of 0.0%), Portuguese (97.9%, a difference of 0.010%), Egyptian (97.9%, a difference of 0.010%), and Immigrants from Venezuela (97.9%, a difference of 0.020%).
| Demographics | Rating | Rank | Kindergarten |
| Immigrants | Venezuela | 47.9 /100 | #177 | Average 97.9% |
| Brazilians | 47.6 /100 | #178 | Average 97.9% |
| Argentineans | 46.8 /100 | #179 | Average 97.9% |
| Immigrants | Bosnia and Herzegovina | 46.7 /100 | #180 | Average 97.9% |
| Portuguese | 43.5 /100 | #181 | Average 97.9% |
| Egyptians | 42.4 /100 | #182 | Average 97.9% |
| Immigrants | Poland | 41.4 /100 | #183 | Average 97.9% |
| Immigrants | Argentina | 40.7 /100 | #184 | Average 97.9% |
| Immigrants | Belarus | 39.4 /100 | #185 | Fair 97.9% |
| Pakistanis | 36.0 /100 | #186 | Fair 97.9% |
| Immigrants | Kazakhstan | 35.9 /100 | #187 | Fair 97.9% |
| Arabs | 35.4 /100 | #188 | Fair 97.9% |
| Paiute | 34.7 /100 | #189 | Fair 97.9% |
| Panamanians | 33.3 /100 | #190 | Fair 97.9% |
| Immigrants | Taiwan | 30.7 /100 | #191 | Fair 97.9% |
Demographics Similar to Armenians by Kindergarten
In terms of kindergarten, the demographic groups most similar to Armenians are Jamaican (97.6%, a difference of 0.010%), Fijian (97.5%, a difference of 0.010%), Taiwanese (97.5%, a difference of 0.010%), Immigrants from Ethiopia (97.5%, a difference of 0.010%), and Immigrants from South America (97.5%, a difference of 0.010%).
| Demographics | Rating | Rank | Kindergarten |
| Immigrants | Iraq | 0.9 /100 | #252 | Tragic 97.6% |
| Immigrants | Africa | 0.8 /100 | #253 | Tragic 97.6% |
| Immigrants | Asia | 0.8 /100 | #254 | Tragic 97.6% |
| Immigrants | Congo | 0.8 /100 | #255 | Tragic 97.6% |
| Yaqui | 0.7 /100 | #256 | Tragic 97.6% |
| Immigrants | Colombia | 0.6 /100 | #257 | Tragic 97.6% |
| Jamaicans | 0.6 /100 | #258 | Tragic 97.6% |
| Armenians | 0.5 /100 | #259 | Tragic 97.6% |
| Fijians | 0.5 /100 | #260 | Tragic 97.5% |
| Taiwanese | 0.4 /100 | #261 | Tragic 97.5% |
| Immigrants | Ethiopia | 0.4 /100 | #262 | Tragic 97.5% |
| Immigrants | South America | 0.4 /100 | #263 | Tragic 97.5% |
| Assyrians/Chaldeans/Syriacs | 0.4 /100 | #264 | Tragic 97.5% |
| Cubans | 0.3 /100 | #265 | Tragic 97.5% |
| Immigrants | Sierra Leone | 0.3 /100 | #266 | Tragic 97.5% |