Sri Lankan vs Armenian Kindergarten
COMPARE
Sri Lankan
Armenian
Kindergarten
Kindergarten Comparison
Sri Lankans
Armenians
97.0%
KINDERGARTEN
0.0/ 100
METRIC RATING
311th/ 347
METRIC RANK
97.6%
KINDERGARTEN
0.5/ 100
METRIC RATING
259th/ 347
METRIC RANK
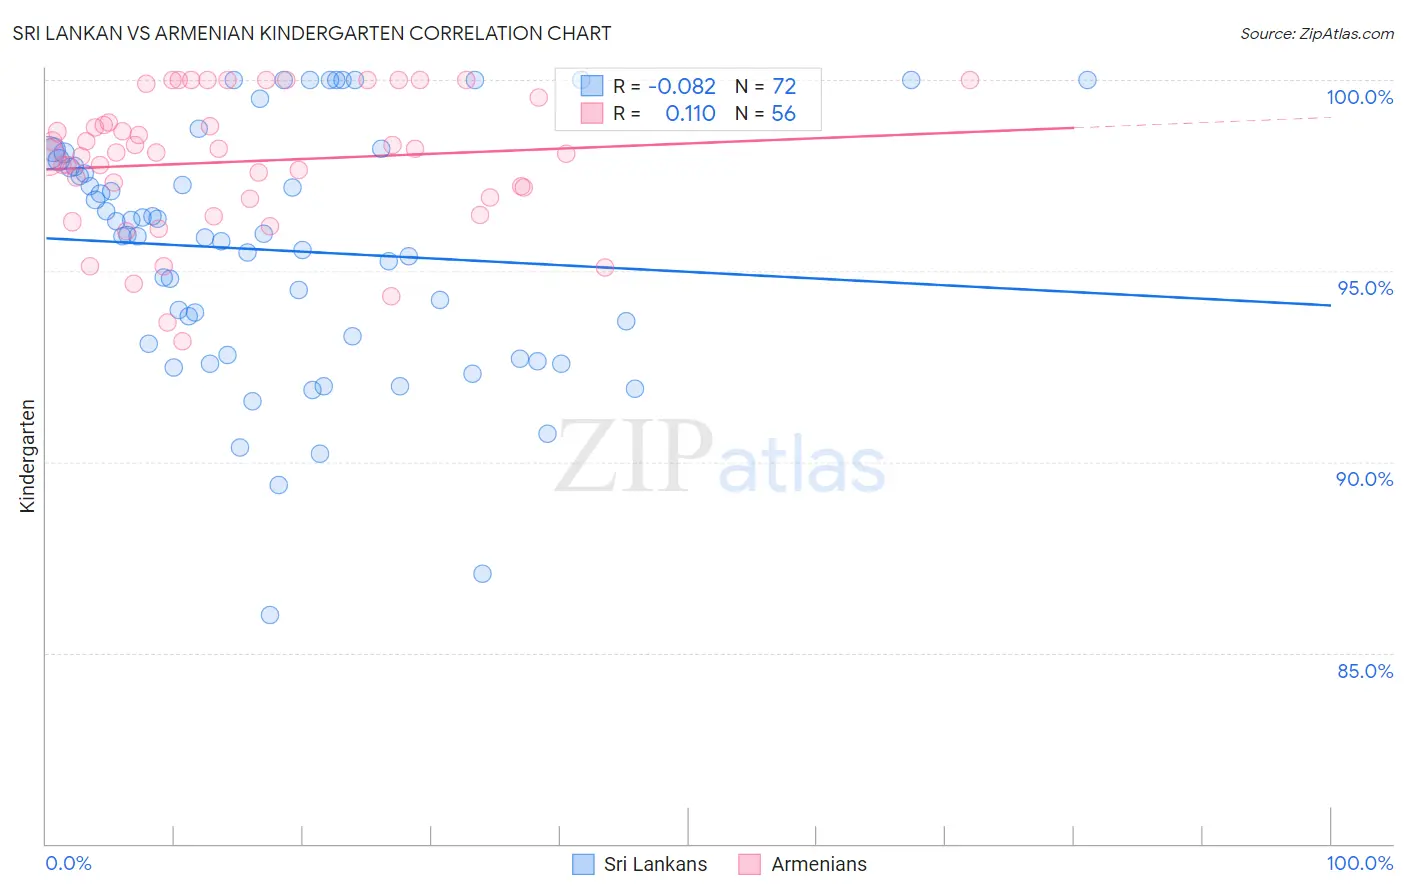
Sri Lankan vs Armenian Kindergarten Correlation Chart
The statistical analysis conducted on geographies consisting of 440,593,746 people shows a slight negative correlation between the proportion of Sri Lankans and percentage of population with at least kindergarten education in the United States with a correlation coefficient (R) of -0.082 and weighted average of 97.0%. Similarly, the statistical analysis conducted on geographies consisting of 310,954,660 people shows a poor positive correlation between the proportion of Armenians and percentage of population with at least kindergarten education in the United States with a correlation coefficient (R) of 0.110 and weighted average of 97.6%, a difference of 0.62%.
Kindergarten Correlation Summary
| Measurement | Sri Lankan | Armenian |
| Minimum | 86.0% | 93.2% |
| Maximum | 100.0% | 100.0% |
| Range | 14.0% | 6.8% |
| Mean | 95.5% | 97.9% |
| Median | 95.9% | 98.1% |
| Interquartile 25% (IQ1) | 92.9% | 96.9% |
| Interquartile 75% (IQ3) | 97.8% | 99.2% |
| Interquartile Range (IQR) | 4.9% | 2.3% |
| Standard Deviation (Sample) | 3.2% | 1.8% |
| Standard Deviation (Population) | 3.2% | 1.8% |
Similar Demographics by Kindergarten
Demographics Similar to Sri Lankans by Kindergarten
In terms of kindergarten, the demographic groups most similar to Sri Lankans are Immigrants from the Azores (97.0%, a difference of 0.0%), Immigrants from Somalia (97.0%, a difference of 0.010%), Immigrants from Haiti (97.0%, a difference of 0.010%), Hispanic or Latino (97.0%, a difference of 0.020%), and Guyanese (96.9%, a difference of 0.020%).
| Demographics | Rating | Rank | Kindergarten |
| Nicaraguans | 0.0 /100 | #304 | Tragic 97.0% |
| Ecuadorians | 0.0 /100 | #305 | Tragic 97.0% |
| Belizeans | 0.0 /100 | #306 | Tragic 97.0% |
| Hispanics or Latinos | 0.0 /100 | #307 | Tragic 97.0% |
| Immigrants | Somalia | 0.0 /100 | #308 | Tragic 97.0% |
| Immigrants | Haiti | 0.0 /100 | #309 | Tragic 97.0% |
| Immigrants | Azores | 0.0 /100 | #310 | Tragic 97.0% |
| Sri Lankans | 0.0 /100 | #311 | Tragic 97.0% |
| Guyanese | 0.0 /100 | #312 | Tragic 96.9% |
| Cape Verdeans | 0.0 /100 | #313 | Tragic 96.9% |
| Hondurans | 0.0 /100 | #314 | Tragic 96.9% |
| Immigrants | Belize | 0.0 /100 | #315 | Tragic 96.9% |
| Immigrants | Nicaragua | 0.0 /100 | #316 | Tragic 96.9% |
| Immigrants | Ecuador | 0.0 /100 | #317 | Tragic 96.9% |
| Immigrants | Laos | 0.0 /100 | #318 | Tragic 96.9% |
Demographics Similar to Armenians by Kindergarten
In terms of kindergarten, the demographic groups most similar to Armenians are Jamaican (97.6%, a difference of 0.010%), Fijian (97.5%, a difference of 0.010%), Taiwanese (97.5%, a difference of 0.010%), Immigrants from Ethiopia (97.5%, a difference of 0.010%), and Immigrants from South America (97.5%, a difference of 0.010%).
| Demographics | Rating | Rank | Kindergarten |
| Immigrants | Iraq | 0.9 /100 | #252 | Tragic 97.6% |
| Immigrants | Africa | 0.8 /100 | #253 | Tragic 97.6% |
| Immigrants | Asia | 0.8 /100 | #254 | Tragic 97.6% |
| Immigrants | Congo | 0.8 /100 | #255 | Tragic 97.6% |
| Yaqui | 0.7 /100 | #256 | Tragic 97.6% |
| Immigrants | Colombia | 0.6 /100 | #257 | Tragic 97.6% |
| Jamaicans | 0.6 /100 | #258 | Tragic 97.6% |
| Armenians | 0.5 /100 | #259 | Tragic 97.6% |
| Fijians | 0.5 /100 | #260 | Tragic 97.5% |
| Taiwanese | 0.4 /100 | #261 | Tragic 97.5% |
| Immigrants | Ethiopia | 0.4 /100 | #262 | Tragic 97.5% |
| Immigrants | South America | 0.4 /100 | #263 | Tragic 97.5% |
| Assyrians/Chaldeans/Syriacs | 0.4 /100 | #264 | Tragic 97.5% |
| Cubans | 0.3 /100 | #265 | Tragic 97.5% |
| Immigrants | Sierra Leone | 0.3 /100 | #266 | Tragic 97.5% |