Uruguayan vs Soviet Union 5th Grade
COMPARE
Uruguayan
Soviet Union
5th Grade
5th Grade Comparison
Uruguayans
Soviet Union
97.0%
5TH GRADE
3.2/ 100
METRIC RATING
235th/ 347
METRIC RANK
97.5%
5TH GRADE
81.2/ 100
METRIC RATING
147th/ 347
METRIC RANK
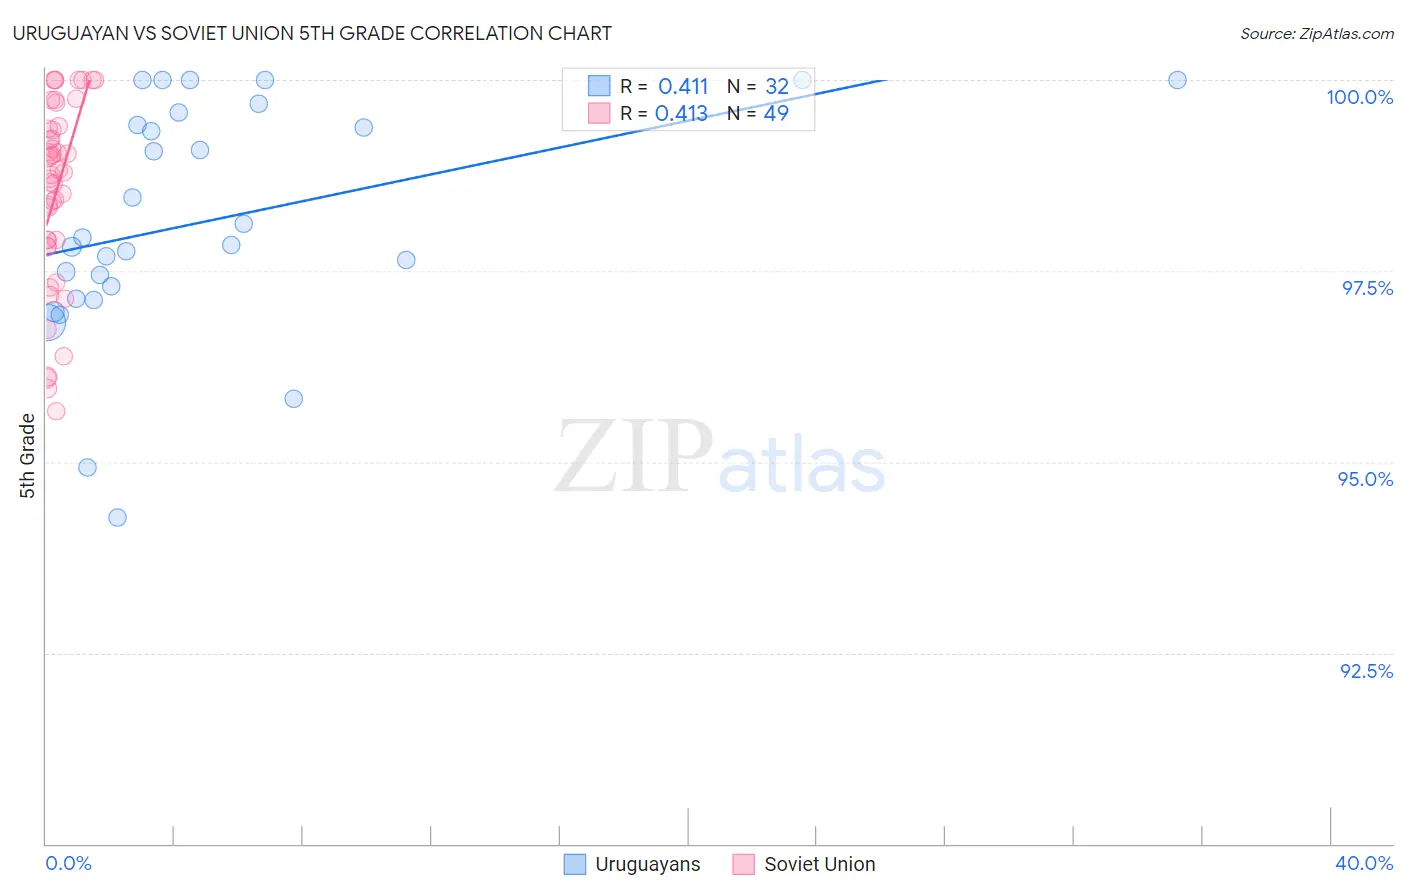
Uruguayan vs Soviet Union 5th Grade Correlation Chart
The statistical analysis conducted on geographies consisting of 144,782,794 people shows a moderate positive correlation between the proportion of Uruguayans and percentage of population with at least 5th grade education in the United States with a correlation coefficient (R) of 0.411 and weighted average of 97.0%. Similarly, the statistical analysis conducted on geographies consisting of 43,454,395 people shows a moderate positive correlation between the proportion of Soviet Union and percentage of population with at least 5th grade education in the United States with a correlation coefficient (R) of 0.413 and weighted average of 97.5%, a difference of 0.51%.
5th Grade Correlation Summary
| Measurement | Uruguayan | Soviet Union |
| Minimum | 94.3% | 95.7% |
| Maximum | 100.0% | 100.0% |
| Range | 5.7% | 4.3% |
| Mean | 98.2% | 98.5% |
| Median | 97.9% | 98.8% |
| Interquartile 25% (IQ1) | 97.2% | 97.9% |
| Interquartile 75% (IQ3) | 99.5% | 99.4% |
| Interquartile Range (IQR) | 2.3% | 1.5% |
| Standard Deviation (Sample) | 1.5% | 1.2% |
| Standard Deviation (Population) | 1.5% | 1.2% |
Similar Demographics by 5th Grade
Demographics Similar to Uruguayans by 5th Grade
In terms of 5th grade, the demographic groups most similar to Uruguayans are Subsaharan African (97.0%, a difference of 0.0%), Tohono O'odham (97.0%, a difference of 0.0%), Immigrants from Eastern Asia (97.0%, a difference of 0.020%), Senegalese (97.0%, a difference of 0.020%), and Immigrants from Western Asia (97.0%, a difference of 0.030%).
| Demographics | Rating | Rank | 5th Grade |
| Assyrians/Chaldeans/Syriacs | 4.5 /100 | #228 | Tragic 97.0% |
| Yuman | 4.5 /100 | #229 | Tragic 97.0% |
| Immigrants | Western Asia | 4.3 /100 | #230 | Tragic 97.0% |
| Immigrants | Malaysia | 4.1 /100 | #231 | Tragic 97.0% |
| Immigrants | Eastern Asia | 4.0 /100 | #232 | Tragic 97.0% |
| Sub-Saharan Africans | 3.3 /100 | #233 | Tragic 97.0% |
| Tohono O'odham | 3.2 /100 | #234 | Tragic 97.0% |
| Uruguayans | 3.2 /100 | #235 | Tragic 97.0% |
| Senegalese | 2.8 /100 | #236 | Tragic 97.0% |
| Immigrants | Indonesia | 2.0 /100 | #237 | Tragic 96.9% |
| Asians | 2.0 /100 | #238 | Tragic 96.9% |
| Nigerians | 1.9 /100 | #239 | Tragic 96.9% |
| Indians (Asian) | 1.9 /100 | #240 | Tragic 96.9% |
| Immigrants | Asia | 1.7 /100 | #241 | Tragic 96.9% |
| Immigrants | Costa Rica | 1.6 /100 | #242 | Tragic 96.9% |
Demographics Similar to Soviet Union by 5th Grade
In terms of 5th grade, the demographic groups most similar to Soviet Union are Immigrants from Greece (97.5%, a difference of 0.010%), Jordanian (97.5%, a difference of 0.010%), Spaniard (97.5%, a difference of 0.010%), Immigrants from Israel (97.5%, a difference of 0.010%), and Hopi (97.5%, a difference of 0.020%).
| Demographics | Rating | Rank | 5th Grade |
| Burmese | 86.1 /100 | #140 | Excellent 97.5% |
| Seminole | 85.8 /100 | #141 | Excellent 97.5% |
| Israelis | 85.5 /100 | #142 | Excellent 97.5% |
| Immigrants | North Macedonia | 85.4 /100 | #143 | Excellent 97.5% |
| Immigrants | Greece | 83.2 /100 | #144 | Excellent 97.5% |
| Jordanians | 82.6 /100 | #145 | Excellent 97.5% |
| Spaniards | 81.9 /100 | #146 | Excellent 97.5% |
| Soviet Union | 81.2 /100 | #147 | Excellent 97.5% |
| Immigrants | Israel | 79.1 /100 | #148 | Good 97.5% |
| Hopi | 78.6 /100 | #149 | Good 97.5% |
| Immigrants | South Central Asia | 78.6 /100 | #150 | Good 97.5% |
| Immigrants | Eastern Europe | 75.0 /100 | #151 | Good 97.4% |
| Ute | 74.9 /100 | #152 | Good 97.4% |
| Alsatians | 74.3 /100 | #153 | Good 97.4% |
| Immigrants | Russia | 71.2 /100 | #154 | Good 97.4% |