Uruguayan vs White/Caucasian 5th Grade
COMPARE
Uruguayan
White/Caucasian
5th Grade
5th Grade Comparison
Uruguayans
Whites/Caucasians
97.0%
5TH GRADE
3.2/ 100
METRIC RATING
235th/ 347
METRIC RANK
97.9%
5TH GRADE
99.8/ 100
METRIC RATING
58th/ 347
METRIC RANK
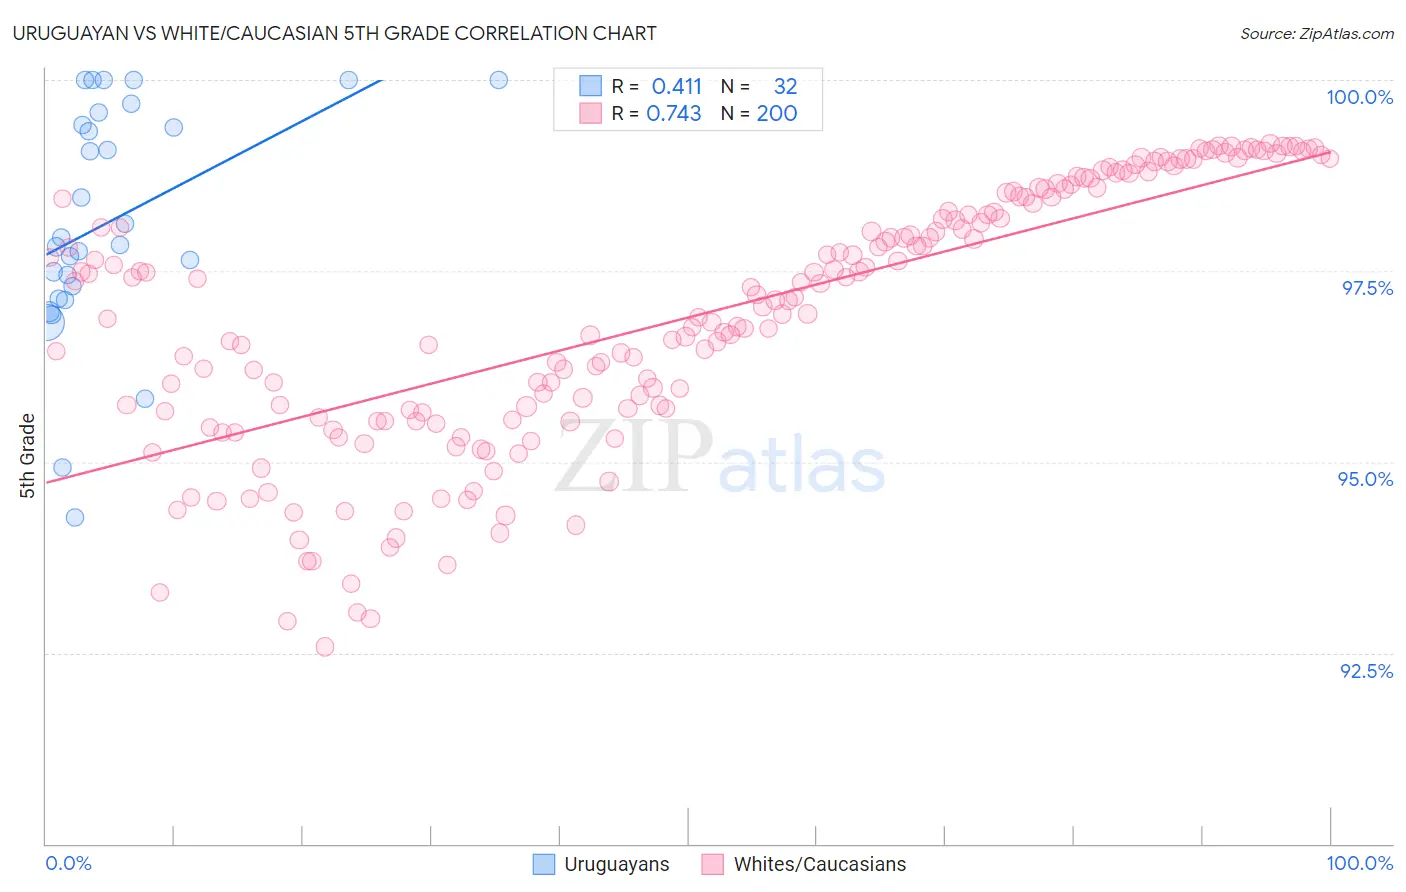
Uruguayan vs White/Caucasian 5th Grade Correlation Chart
The statistical analysis conducted on geographies consisting of 144,782,794 people shows a moderate positive correlation between the proportion of Uruguayans and percentage of population with at least 5th grade education in the United States with a correlation coefficient (R) of 0.411 and weighted average of 97.0%. Similarly, the statistical analysis conducted on geographies consisting of 585,247,232 people shows a strong positive correlation between the proportion of Whites/Caucasians and percentage of population with at least 5th grade education in the United States with a correlation coefficient (R) of 0.743 and weighted average of 97.9%, a difference of 0.99%.
5th Grade Correlation Summary
| Measurement | Uruguayan | White/Caucasian |
| Minimum | 94.3% | 92.6% |
| Maximum | 100.0% | 99.2% |
| Range | 5.7% | 6.6% |
| Mean | 98.2% | 96.9% |
| Median | 97.9% | 97.1% |
| Interquartile 25% (IQ1) | 97.2% | 95.6% |
| Interquartile 75% (IQ3) | 99.5% | 98.5% |
| Interquartile Range (IQR) | 2.3% | 2.8% |
| Standard Deviation (Sample) | 1.5% | 1.7% |
| Standard Deviation (Population) | 1.5% | 1.7% |
Similar Demographics by 5th Grade
Demographics Similar to Uruguayans by 5th Grade
In terms of 5th grade, the demographic groups most similar to Uruguayans are Subsaharan African (97.0%, a difference of 0.0%), Tohono O'odham (97.0%, a difference of 0.0%), Immigrants from Eastern Asia (97.0%, a difference of 0.020%), Senegalese (97.0%, a difference of 0.020%), and Immigrants from Western Asia (97.0%, a difference of 0.030%).
| Demographics | Rating | Rank | 5th Grade |
| Assyrians/Chaldeans/Syriacs | 4.5 /100 | #228 | Tragic 97.0% |
| Yuman | 4.5 /100 | #229 | Tragic 97.0% |
| Immigrants | Western Asia | 4.3 /100 | #230 | Tragic 97.0% |
| Immigrants | Malaysia | 4.1 /100 | #231 | Tragic 97.0% |
| Immigrants | Eastern Asia | 4.0 /100 | #232 | Tragic 97.0% |
| Sub-Saharan Africans | 3.3 /100 | #233 | Tragic 97.0% |
| Tohono O'odham | 3.2 /100 | #234 | Tragic 97.0% |
| Uruguayans | 3.2 /100 | #235 | Tragic 97.0% |
| Senegalese | 2.8 /100 | #236 | Tragic 97.0% |
| Immigrants | Indonesia | 2.0 /100 | #237 | Tragic 96.9% |
| Asians | 2.0 /100 | #238 | Tragic 96.9% |
| Nigerians | 1.9 /100 | #239 | Tragic 96.9% |
| Indians (Asian) | 1.9 /100 | #240 | Tragic 96.9% |
| Immigrants | Asia | 1.7 /100 | #241 | Tragic 96.9% |
| Immigrants | Costa Rica | 1.6 /100 | #242 | Tragic 96.9% |
Demographics Similar to Whites/Caucasians by 5th Grade
In terms of 5th grade, the demographic groups most similar to Whites/Caucasians are Greek (97.9%, a difference of 0.0%), Austrian (97.9%, a difference of 0.0%), Australian (98.0%, a difference of 0.010%), Creek (98.0%, a difference of 0.010%), and American (97.9%, a difference of 0.010%).
| Demographics | Rating | Rank | 5th Grade |
| Celtics | 99.8 /100 | #51 | Exceptional 98.0% |
| Maltese | 99.8 /100 | #52 | Exceptional 98.0% |
| Slavs | 99.8 /100 | #53 | Exceptional 98.0% |
| Australians | 99.8 /100 | #54 | Exceptional 98.0% |
| Creek | 99.8 /100 | #55 | Exceptional 98.0% |
| Greeks | 99.8 /100 | #56 | Exceptional 97.9% |
| Austrians | 99.8 /100 | #57 | Exceptional 97.9% |
| Whites/Caucasians | 99.8 /100 | #58 | Exceptional 97.9% |
| Americans | 99.7 /100 | #59 | Exceptional 97.9% |
| Immigrants | Canada | 99.7 /100 | #60 | Exceptional 97.9% |
| Serbians | 99.7 /100 | #61 | Exceptional 97.9% |
| Immigrants | North America | 99.7 /100 | #62 | Exceptional 97.9% |
| Russians | 99.7 /100 | #63 | Exceptional 97.9% |
| Immigrants | Northern Europe | 99.6 /100 | #64 | Exceptional 97.9% |
| Canadians | 99.6 /100 | #65 | Exceptional 97.9% |