Immigrants from Uganda vs Soviet Union 5th Grade
COMPARE
Immigrants from Uganda
Soviet Union
5th Grade
5th Grade Comparison
Immigrants from Uganda
Soviet Union
97.2%
5TH GRADE
21.1/ 100
METRIC RATING
198th/ 347
METRIC RANK
97.5%
5TH GRADE
81.2/ 100
METRIC RATING
147th/ 347
METRIC RANK
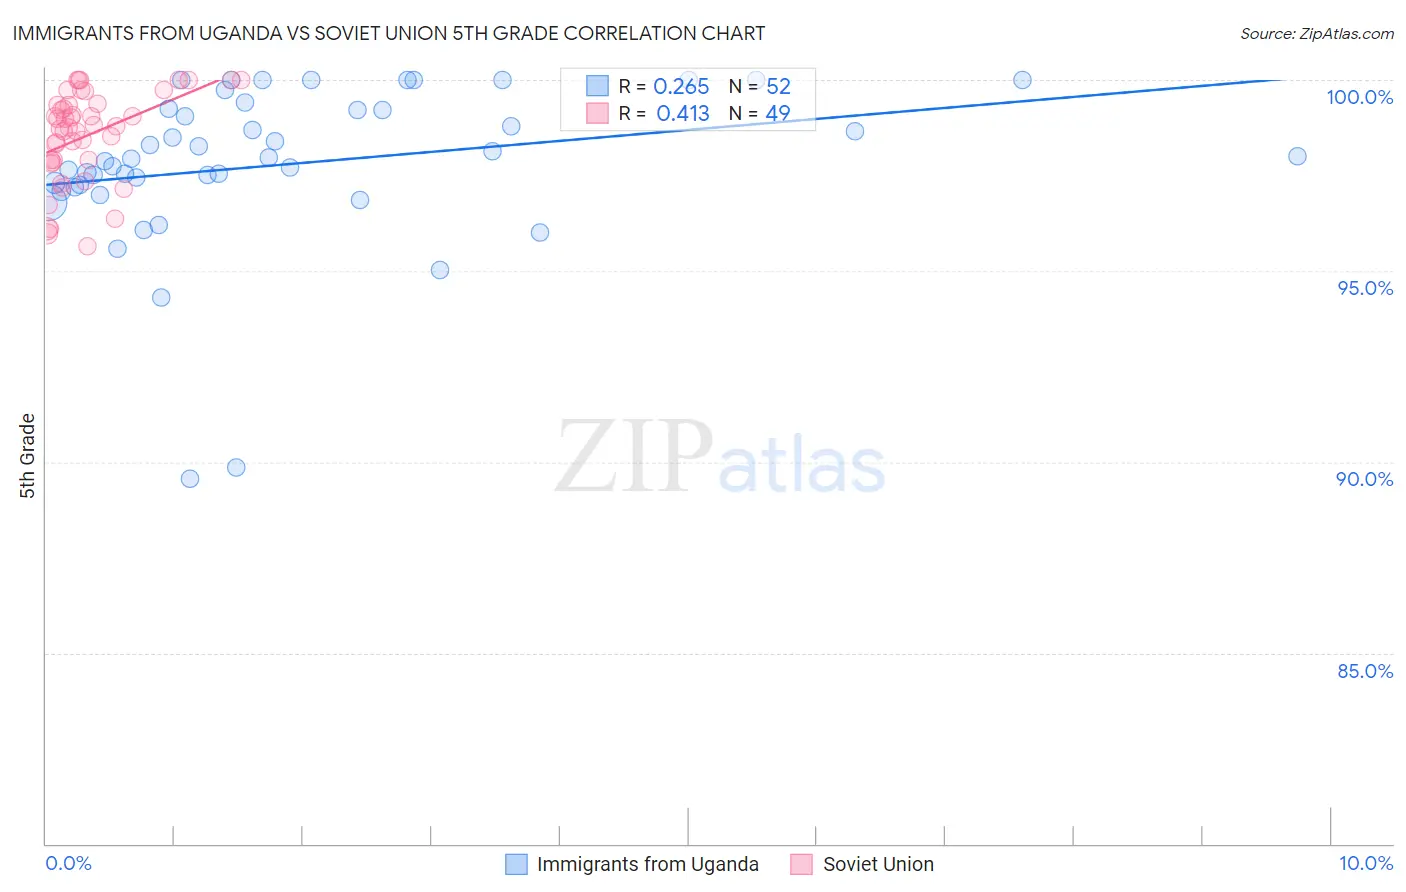
Immigrants from Uganda vs Soviet Union 5th Grade Correlation Chart
The statistical analysis conducted on geographies consisting of 125,941,298 people shows a weak positive correlation between the proportion of Immigrants from Uganda and percentage of population with at least 5th grade education in the United States with a correlation coefficient (R) of 0.265 and weighted average of 97.2%. Similarly, the statistical analysis conducted on geographies consisting of 43,454,395 people shows a moderate positive correlation between the proportion of Soviet Union and percentage of population with at least 5th grade education in the United States with a correlation coefficient (R) of 0.413 and weighted average of 97.5%, a difference of 0.29%.
5th Grade Correlation Summary
| Measurement | Immigrants from Uganda | Soviet Union |
| Minimum | 89.6% | 95.7% |
| Maximum | 100.0% | 100.0% |
| Range | 10.4% | 4.3% |
| Mean | 97.8% | 98.5% |
| Median | 98.0% | 98.8% |
| Interquartile 25% (IQ1) | 97.2% | 97.9% |
| Interquartile 75% (IQ3) | 99.2% | 99.4% |
| Interquartile Range (IQR) | 2.0% | 1.5% |
| Standard Deviation (Sample) | 2.1% | 1.2% |
| Standard Deviation (Population) | 2.1% | 1.2% |
Similar Demographics by 5th Grade
Demographics Similar to Immigrants from Uganda by 5th Grade
In terms of 5th grade, the demographic groups most similar to Immigrants from Uganda are Native/Alaskan (97.2%, a difference of 0.020%), Guamanian/Chamorro (97.2%, a difference of 0.030%), Hawaiian (97.2%, a difference of 0.030%), Brazilian (97.2%, a difference of 0.030%), and Immigrants from Northern Africa (97.2%, a difference of 0.030%).
| Demographics | Rating | Rank | 5th Grade |
| Immigrants | Brazil | 31.5 /100 | #191 | Fair 97.3% |
| Panamanians | 31.3 /100 | #192 | Fair 97.3% |
| Navajo | 29.0 /100 | #193 | Fair 97.2% |
| Immigrants | Albania | 28.5 /100 | #194 | Fair 97.2% |
| Guamanians/Chamorros | 26.8 /100 | #195 | Fair 97.2% |
| Hawaiians | 25.6 /100 | #196 | Fair 97.2% |
| Brazilians | 25.4 /100 | #197 | Fair 97.2% |
| Immigrants | Uganda | 21.1 /100 | #198 | Fair 97.2% |
| Natives/Alaskans | 18.0 /100 | #199 | Poor 97.2% |
| Immigrants | Northern Africa | 16.8 /100 | #200 | Poor 97.2% |
| Immigrants | Chile | 16.6 /100 | #201 | Poor 97.2% |
| Africans | 15.3 /100 | #202 | Poor 97.2% |
| Immigrants | Bahamas | 14.9 /100 | #203 | Poor 97.2% |
| Immigrants | Zaire | 13.7 /100 | #204 | Poor 97.1% |
| Moroccans | 12.0 /100 | #205 | Poor 97.1% |
Demographics Similar to Soviet Union by 5th Grade
In terms of 5th grade, the demographic groups most similar to Soviet Union are Immigrants from Greece (97.5%, a difference of 0.010%), Jordanian (97.5%, a difference of 0.010%), Spaniard (97.5%, a difference of 0.010%), Immigrants from Israel (97.5%, a difference of 0.010%), and Hopi (97.5%, a difference of 0.020%).
| Demographics | Rating | Rank | 5th Grade |
| Burmese | 86.1 /100 | #140 | Excellent 97.5% |
| Seminole | 85.8 /100 | #141 | Excellent 97.5% |
| Israelis | 85.5 /100 | #142 | Excellent 97.5% |
| Immigrants | North Macedonia | 85.4 /100 | #143 | Excellent 97.5% |
| Immigrants | Greece | 83.2 /100 | #144 | Excellent 97.5% |
| Jordanians | 82.6 /100 | #145 | Excellent 97.5% |
| Spaniards | 81.9 /100 | #146 | Excellent 97.5% |
| Soviet Union | 81.2 /100 | #147 | Excellent 97.5% |
| Immigrants | Israel | 79.1 /100 | #148 | Good 97.5% |
| Hopi | 78.6 /100 | #149 | Good 97.5% |
| Immigrants | South Central Asia | 78.6 /100 | #150 | Good 97.5% |
| Immigrants | Eastern Europe | 75.0 /100 | #151 | Good 97.4% |
| Ute | 74.9 /100 | #152 | Good 97.4% |
| Alsatians | 74.3 /100 | #153 | Good 97.4% |
| Immigrants | Russia | 71.2 /100 | #154 | Good 97.4% |