Uruguayan vs Scotch-Irish College, Under 1 year
COMPARE
Uruguayan
Scotch-Irish
College, Under 1 year
College, Under 1 year Comparison
Uruguayans
Scotch-Irish
64.2%
COLLEGE, UNDER 1 YEAR
15.6/ 100
METRIC RATING
203rd/ 347
METRIC RANK
65.4%
COLLEGE, UNDER 1 YEAR
49.5/ 100
METRIC RATING
175th/ 347
METRIC RANK
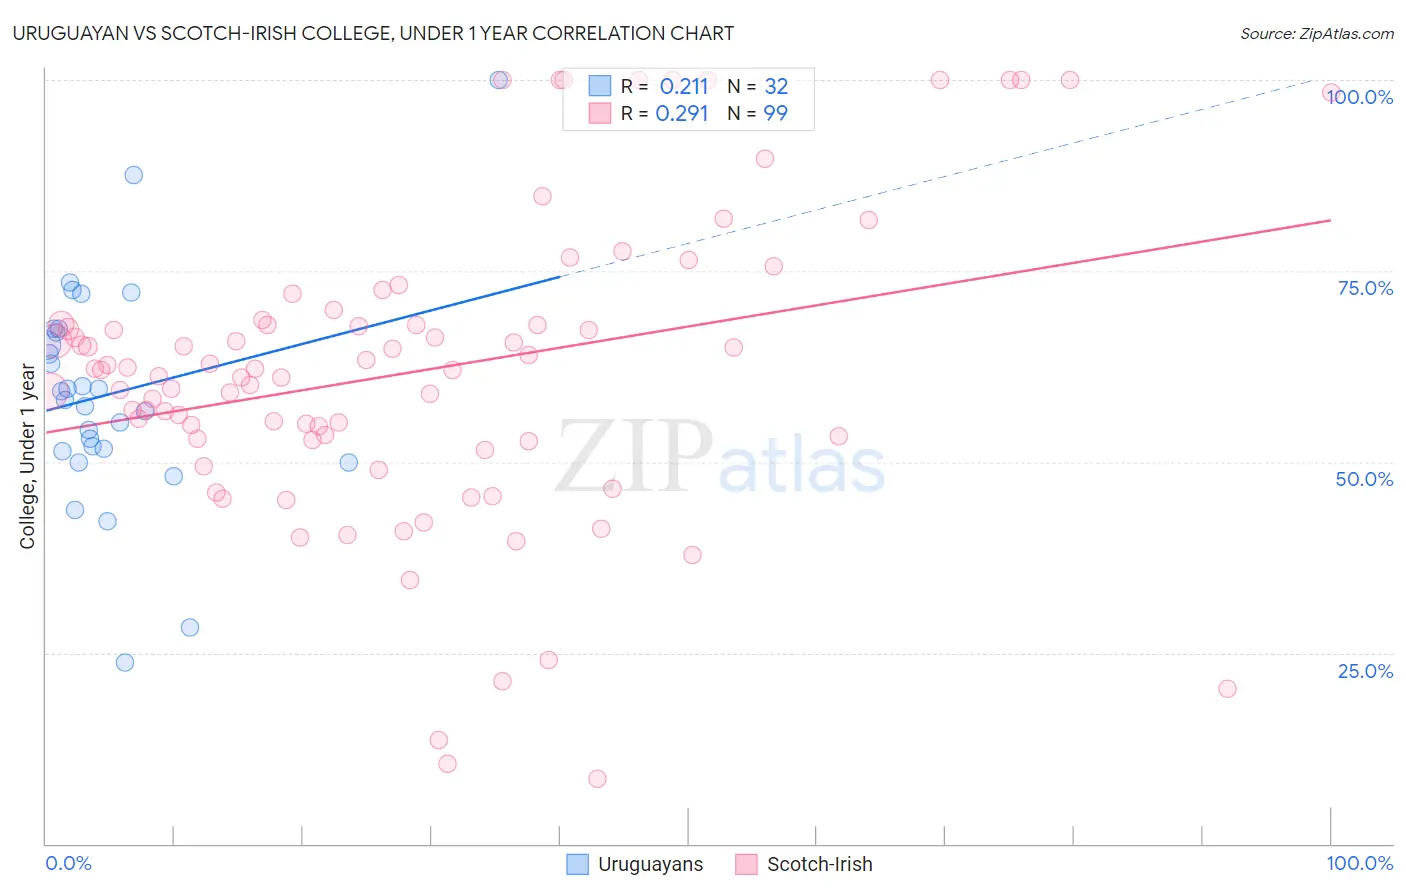
Uruguayan vs Scotch-Irish College, Under 1 year Correlation Chart
The statistical analysis conducted on geographies consisting of 144,782,794 people shows a weak positive correlation between the proportion of Uruguayans and percentage of population with at least college, under 1 year education in the United States with a correlation coefficient (R) of 0.211 and weighted average of 64.2%. Similarly, the statistical analysis conducted on geographies consisting of 548,775,844 people shows a weak positive correlation between the proportion of Scotch-Irish and percentage of population with at least college, under 1 year education in the United States with a correlation coefficient (R) of 0.291 and weighted average of 65.4%, a difference of 1.9%.
College, Under 1 year Correlation Summary
| Measurement | Uruguayan | Scotch-Irish |
| Minimum | 23.7% | 8.6% |
| Maximum | 100.0% | 100.0% |
| Range | 76.2% | 91.4% |
| Mean | 58.9% | 61.8% |
| Median | 58.7% | 62.1% |
| Interquartile 25% (IQ1) | 51.6% | 52.8% |
| Interquartile 75% (IQ3) | 67.2% | 68.1% |
| Interquartile Range (IQR) | 15.6% | 15.3% |
| Standard Deviation (Sample) | 14.8% | 20.0% |
| Standard Deviation (Population) | 14.5% | 19.9% |
Similar Demographics by College, Under 1 year
Demographics Similar to Uruguayans by College, Under 1 year
In terms of college, under 1 year, the demographic groups most similar to Uruguayans are French Canadian (64.2%, a difference of 0.050%), South American (64.2%, a difference of 0.050%), Nigerian (64.3%, a difference of 0.090%), Immigrants from Zaire (64.1%, a difference of 0.090%), and Panamanian (64.3%, a difference of 0.11%).
| Demographics | Rating | Rank | College, Under 1 year |
| Tongans | 21.2 /100 | #196 | Fair 64.5% |
| Costa Ricans | 19.6 /100 | #197 | Poor 64.4% |
| Tsimshian | 17.9 /100 | #198 | Poor 64.3% |
| Panamanians | 17.0 /100 | #199 | Poor 64.3% |
| Nigerians | 16.7 /100 | #200 | Poor 64.3% |
| French Canadians | 16.3 /100 | #201 | Poor 64.2% |
| South Americans | 16.2 /100 | #202 | Poor 64.2% |
| Uruguayans | 15.6 /100 | #203 | Poor 64.2% |
| Immigrants | Zaire | 14.6 /100 | #204 | Poor 64.1% |
| Peruvians | 13.7 /100 | #205 | Poor 64.1% |
| Whites/Caucasians | 12.8 /100 | #206 | Poor 64.0% |
| Colombians | 12.4 /100 | #207 | Poor 64.0% |
| Immigrants | Vietnam | 12.1 /100 | #208 | Poor 64.0% |
| Puget Sound Salish | 11.3 /100 | #209 | Poor 63.9% |
| Ghanaians | 11.2 /100 | #210 | Poor 63.9% |
Demographics Similar to Scotch-Irish by College, Under 1 year
In terms of college, under 1 year, the demographic groups most similar to Scotch-Irish are Immigrants from Bosnia and Herzegovina (65.4%, a difference of 0.020%), French (65.4%, a difference of 0.030%), Immigrants from North Macedonia (65.4%, a difference of 0.040%), German Russian (65.4%, a difference of 0.050%), and Guamanian/Chamorro (65.4%, a difference of 0.060%).
| Demographics | Rating | Rank | College, Under 1 year |
| Hungarians | 55.9 /100 | #168 | Average 65.6% |
| Yugoslavians | 55.7 /100 | #169 | Average 65.6% |
| Germans | 55.7 /100 | #170 | Average 65.6% |
| Immigrants | Oceania | 55.0 /100 | #171 | Average 65.6% |
| South American Indians | 54.4 /100 | #172 | Average 65.5% |
| Swiss | 53.9 /100 | #173 | Average 65.5% |
| Immigrants | Bosnia and Herzegovina | 50.0 /100 | #174 | Average 65.4% |
| Scotch-Irish | 49.5 /100 | #175 | Average 65.4% |
| French | 48.9 /100 | #176 | Average 65.4% |
| Immigrants | North Macedonia | 48.6 /100 | #177 | Average 65.4% |
| German Russians | 48.3 /100 | #178 | Average 65.4% |
| Guamanians/Chamorros | 48.2 /100 | #179 | Average 65.4% |
| Dutch | 46.1 /100 | #180 | Average 65.3% |
| Spaniards | 45.5 /100 | #181 | Average 65.3% |
| Immigrants | Africa | 44.7 /100 | #182 | Average 65.3% |