Ukrainian vs Immigrants from South Africa Doctorate Degree
COMPARE
Ukrainian
Immigrants from South Africa
Doctorate Degree
Doctorate Degree Comparison
Ukrainians
Immigrants from South Africa
2.1%
DOCTORATE DEGREE
97.2/ 100
METRIC RATING
109th/ 347
METRIC RANK
2.4%
DOCTORATE DEGREE
100.0/ 100
METRIC RATING
45th/ 347
METRIC RANK
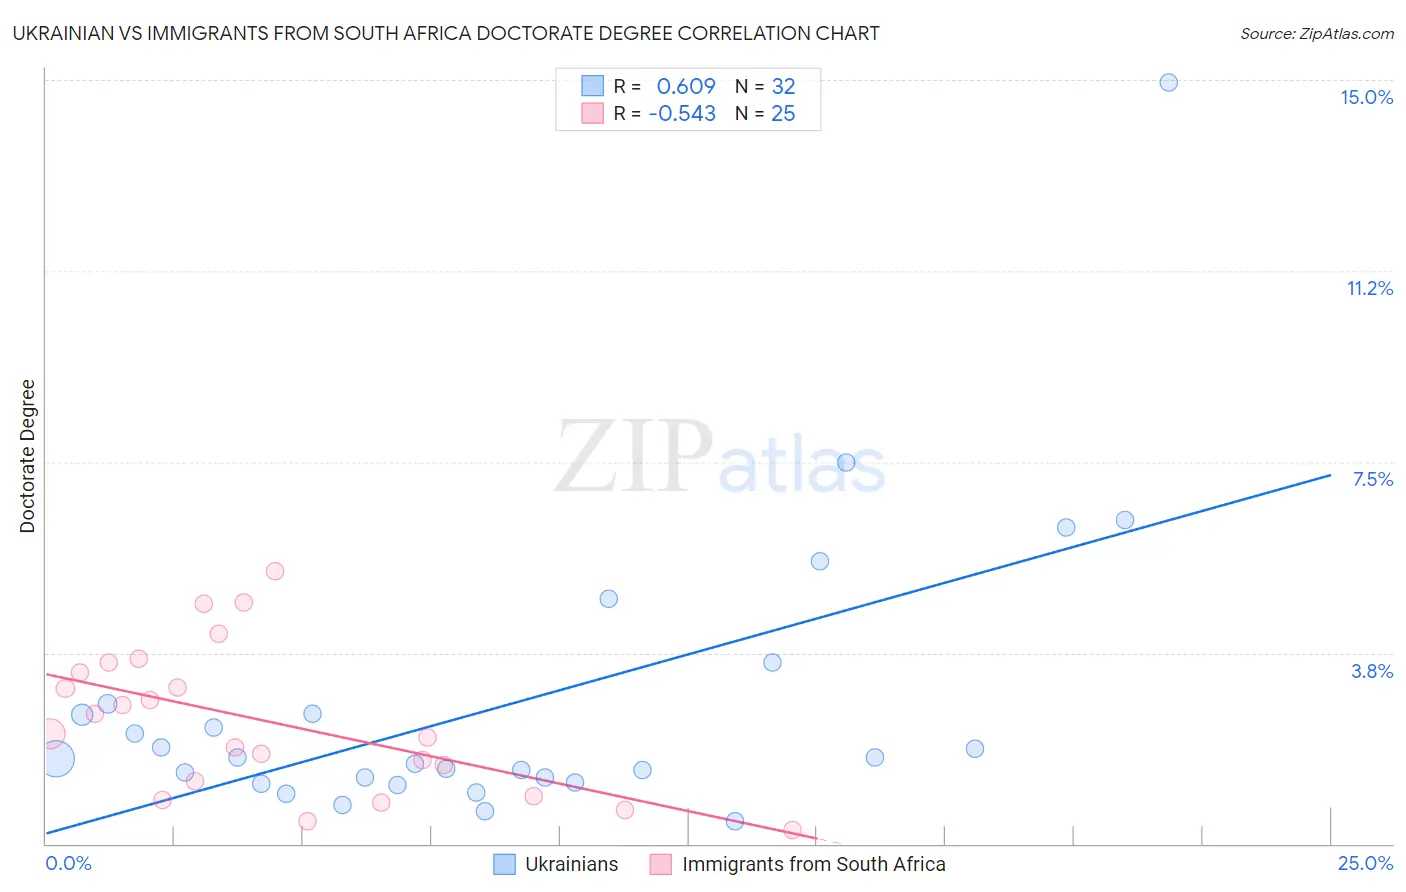
Ukrainian vs Immigrants from South Africa Doctorate Degree Correlation Chart
The statistical analysis conducted on geographies consisting of 442,609,688 people shows a significant positive correlation between the proportion of Ukrainians and percentage of population with at least doctorate degree education in the United States with a correlation coefficient (R) of 0.609 and weighted average of 2.1%. Similarly, the statistical analysis conducted on geographies consisting of 232,384,340 people shows a substantial negative correlation between the proportion of Immigrants from South Africa and percentage of population with at least doctorate degree education in the United States with a correlation coefficient (R) of -0.543 and weighted average of 2.4%, a difference of 17.5%.
Doctorate Degree Correlation Summary
| Measurement | Ukrainian | Immigrants from South Africa |
| Minimum | 0.44% | 0.27% |
| Maximum | 14.9% | 5.3% |
| Range | 14.5% | 5.1% |
| Mean | 2.7% | 2.4% |
| Median | 1.7% | 2.2% |
| Interquartile 25% (IQ1) | 1.2% | 1.1% |
| Interquartile 75% (IQ3) | 2.6% | 3.5% |
| Interquartile Range (IQR) | 1.4% | 2.4% |
| Standard Deviation (Sample) | 2.9% | 1.4% |
| Standard Deviation (Population) | 2.8% | 1.4% |
Similar Demographics by Doctorate Degree
Demographics Similar to Ukrainians by Doctorate Degree
In terms of doctorate degree, the demographic groups most similar to Ukrainians are Immigrants from Germany (2.1%, a difference of 0.060%), Brazilian (2.1%, a difference of 0.070%), Immigrants from Pakistan (2.1%, a difference of 0.13%), Syrian (2.1%, a difference of 0.15%), and European (2.1%, a difference of 0.28%).
| Demographics | Rating | Rank | Doctorate Degree |
| Immigrants | Chile | 98.1 /100 | #102 | Exceptional 2.1% |
| Romanians | 98.1 /100 | #103 | Exceptional 2.1% |
| Austrians | 98.0 /100 | #104 | Exceptional 2.1% |
| Arabs | 97.8 /100 | #105 | Exceptional 2.1% |
| Sudanese | 97.7 /100 | #106 | Exceptional 2.1% |
| Europeans | 97.5 /100 | #107 | Exceptional 2.1% |
| Immigrants | Germany | 97.3 /100 | #108 | Exceptional 2.1% |
| Ukrainians | 97.2 /100 | #109 | Exceptional 2.1% |
| Brazilians | 97.2 /100 | #110 | Exceptional 2.1% |
| Immigrants | Pakistan | 97.1 /100 | #111 | Exceptional 2.1% |
| Syrians | 97.1 /100 | #112 | Exceptional 2.1% |
| Immigrants | Italy | 96.9 /100 | #113 | Exceptional 2.1% |
| Immigrants | Croatia | 96.8 /100 | #114 | Exceptional 2.1% |
| Taiwanese | 96.7 /100 | #115 | Exceptional 2.1% |
| Maltese | 96.2 /100 | #116 | Exceptional 2.1% |
Demographics Similar to Immigrants from South Africa by Doctorate Degree
In terms of doctorate degree, the demographic groups most similar to Immigrants from South Africa are Immigrants from Austria (2.4%, a difference of 0.14%), Immigrants from Western Europe (2.4%, a difference of 0.36%), Asian (2.4%, a difference of 0.57%), Immigrants from Asia (2.4%, a difference of 0.70%), and Immigrants from Netherlands (2.5%, a difference of 1.5%).
| Demographics | Rating | Rank | Doctorate Degree |
| Russians | 100.0 /100 | #38 | Exceptional 2.6% |
| Immigrants | Ireland | 100.0 /100 | #39 | Exceptional 2.5% |
| Estonians | 100.0 /100 | #40 | Exceptional 2.5% |
| Immigrants | Russia | 100.0 /100 | #41 | Exceptional 2.5% |
| New Zealanders | 100.0 /100 | #42 | Exceptional 2.5% |
| Soviet Union | 100.0 /100 | #43 | Exceptional 2.5% |
| Immigrants | Netherlands | 100.0 /100 | #44 | Exceptional 2.5% |
| Immigrants | South Africa | 100.0 /100 | #45 | Exceptional 2.4% |
| Immigrants | Austria | 100.0 /100 | #46 | Exceptional 2.4% |
| Immigrants | Western Europe | 100.0 /100 | #47 | Exceptional 2.4% |
| Asians | 100.0 /100 | #48 | Exceptional 2.4% |
| Immigrants | Asia | 100.0 /100 | #49 | Exceptional 2.4% |
| Immigrants | Norway | 100.0 /100 | #50 | Exceptional 2.4% |
| Australians | 100.0 /100 | #51 | Exceptional 2.4% |
| Bulgarians | 100.0 /100 | #52 | Exceptional 2.4% |