Immigrants from Liberia vs Osage Professional Degree
COMPARE
Immigrants from Liberia
Osage
Professional Degree
Professional Degree Comparison
Immigrants from Liberia
Osage
3.4%
PROFESSIONAL DEGREE
0.2/ 100
METRIC RATING
297th/ 347
METRIC RANK
3.7%
PROFESSIONAL DEGREE
1.2/ 100
METRIC RATING
255th/ 347
METRIC RANK
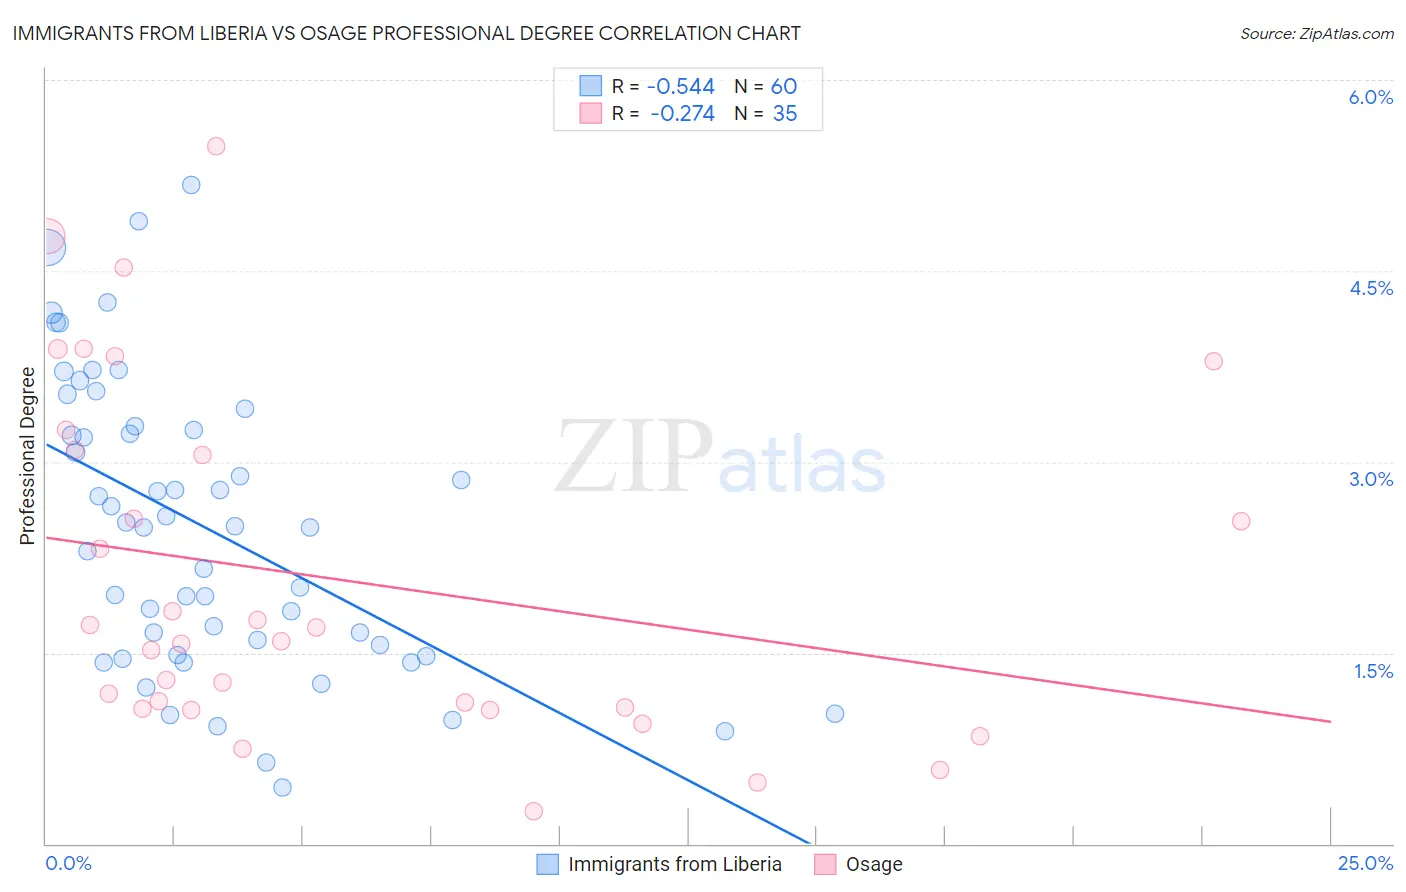
Immigrants from Liberia vs Osage Professional Degree Correlation Chart
The statistical analysis conducted on geographies consisting of 135,135,221 people shows a substantial negative correlation between the proportion of Immigrants from Liberia and percentage of population with at least professional degree education in the United States with a correlation coefficient (R) of -0.544 and weighted average of 3.4%. Similarly, the statistical analysis conducted on geographies consisting of 91,695,993 people shows a weak negative correlation between the proportion of Osage and percentage of population with at least professional degree education in the United States with a correlation coefficient (R) of -0.274 and weighted average of 3.7%, a difference of 7.8%.
Professional Degree Correlation Summary
| Measurement | Immigrants from Liberia | Osage |
| Minimum | 0.44% | 0.26% |
| Maximum | 5.2% | 5.5% |
| Range | 4.7% | 5.2% |
| Mean | 2.5% | 2.1% |
| Median | 2.5% | 1.6% |
| Interquartile 25% (IQ1) | 1.5% | 1.1% |
| Interquartile 75% (IQ3) | 3.3% | 3.1% |
| Interquartile Range (IQR) | 1.7% | 2.0% |
| Standard Deviation (Sample) | 1.1% | 1.4% |
| Standard Deviation (Population) | 1.1% | 1.3% |
Similar Demographics by Professional Degree
Demographics Similar to Immigrants from Liberia by Professional Degree
In terms of professional degree, the demographic groups most similar to Immigrants from Liberia are Ottawa (3.4%, a difference of 0.050%), Hawaiian (3.4%, a difference of 0.34%), Immigrants from Guatemala (3.4%, a difference of 0.35%), Paiute (3.4%, a difference of 0.50%), and Immigrants from Honduras (3.5%, a difference of 0.59%).
| Demographics | Rating | Rank | Professional Degree |
| Chippewa | 0.3 /100 | #290 | Tragic 3.5% |
| Alaska Natives | 0.3 /100 | #291 | Tragic 3.5% |
| Immigrants | Belize | 0.3 /100 | #292 | Tragic 3.5% |
| Immigrants | Honduras | 0.3 /100 | #293 | Tragic 3.5% |
| Paiute | 0.3 /100 | #294 | Tragic 3.4% |
| Immigrants | Guatemala | 0.2 /100 | #295 | Tragic 3.4% |
| Hawaiians | 0.2 /100 | #296 | Tragic 3.4% |
| Immigrants | Liberia | 0.2 /100 | #297 | Tragic 3.4% |
| Ottawa | 0.2 /100 | #298 | Tragic 3.4% |
| Immigrants | Yemen | 0.2 /100 | #299 | Tragic 3.4% |
| Blacks/African Americans | 0.2 /100 | #300 | Tragic 3.4% |
| Immigrants | Dominican Republic | 0.2 /100 | #301 | Tragic 3.4% |
| Malaysians | 0.2 /100 | #302 | Tragic 3.4% |
| Immigrants | Haiti | 0.2 /100 | #303 | Tragic 3.4% |
| Cajuns | 0.2 /100 | #304 | Tragic 3.4% |
Demographics Similar to Osage by Professional Degree
In terms of professional degree, the demographic groups most similar to Osage are Iroquois (3.7%, a difference of 0.10%), Tongan (3.7%, a difference of 0.43%), Bahamian (3.7%, a difference of 0.47%), Immigrants from St. Vincent and the Grenadines (3.7%, a difference of 0.54%), and Pueblo (3.7%, a difference of 0.57%).
| Demographics | Rating | Rank | Professional Degree |
| Hmong | 1.6 /100 | #248 | Tragic 3.7% |
| Immigrants | Grenada | 1.5 /100 | #249 | Tragic 3.7% |
| Immigrants | Fiji | 1.5 /100 | #250 | Tragic 3.7% |
| Immigrants | Nicaragua | 1.4 /100 | #251 | Tragic 3.7% |
| Jamaicans | 1.4 /100 | #252 | Tragic 3.7% |
| Pueblo | 1.4 /100 | #253 | Tragic 3.7% |
| Tongans | 1.3 /100 | #254 | Tragic 3.7% |
| Osage | 1.2 /100 | #255 | Tragic 3.7% |
| Iroquois | 1.2 /100 | #256 | Tragic 3.7% |
| Bahamians | 1.1 /100 | #257 | Tragic 3.7% |
| Immigrants | St. Vincent and the Grenadines | 1.1 /100 | #258 | Tragic 3.7% |
| Africans | 1.0 /100 | #259 | Tragic 3.7% |
| Indonesians | 1.0 /100 | #260 | Tragic 3.7% |
| Immigrants | Guyana | 1.0 /100 | #261 | Tragic 3.7% |
| U.S. Virgin Islanders | 1.0 /100 | #262 | Tragic 3.7% |