French vs Osage Professional Degree
COMPARE
French
Osage
Professional Degree
Professional Degree Comparison
French
Osage
4.2%
PROFESSIONAL DEGREE
27.1/ 100
METRIC RATING
193rd/ 347
METRIC RANK
3.7%
PROFESSIONAL DEGREE
1.2/ 100
METRIC RATING
255th/ 347
METRIC RANK
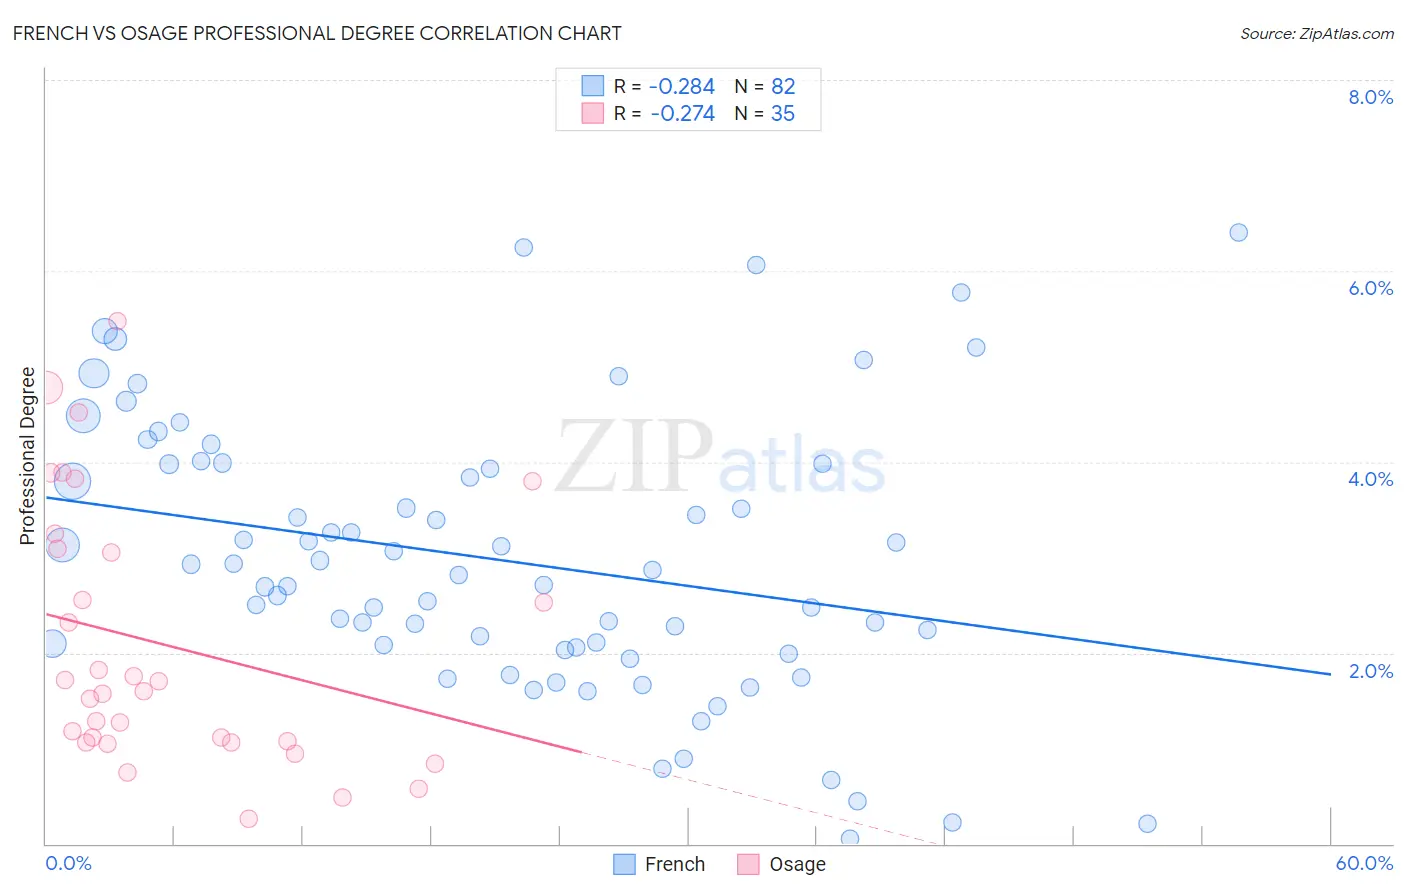
French vs Osage Professional Degree Correlation Chart
The statistical analysis conducted on geographies consisting of 564,087,067 people shows a weak negative correlation between the proportion of French and percentage of population with at least professional degree education in the United States with a correlation coefficient (R) of -0.284 and weighted average of 4.2%. Similarly, the statistical analysis conducted on geographies consisting of 91,695,993 people shows a weak negative correlation between the proportion of Osage and percentage of population with at least professional degree education in the United States with a correlation coefficient (R) of -0.274 and weighted average of 3.7%, a difference of 14.8%.
Professional Degree Correlation Summary
| Measurement | French | Osage |
| Minimum | 0.047% | 0.26% |
| Maximum | 6.4% | 5.5% |
| Range | 6.4% | 5.2% |
| Mean | 3.0% | 2.1% |
| Median | 2.8% | 1.6% |
| Interquartile 25% (IQ1) | 2.1% | 1.1% |
| Interquartile 75% (IQ3) | 4.0% | 3.1% |
| Interquartile Range (IQR) | 1.9% | 2.0% |
| Standard Deviation (Sample) | 1.4% | 1.4% |
| Standard Deviation (Population) | 1.4% | 1.3% |
Similar Demographics by Professional Degree
Demographics Similar to French by Professional Degree
In terms of professional degree, the demographic groups most similar to French are Ghanaian (4.3%, a difference of 0.040%), Scandinavian (4.2%, a difference of 0.25%), Sri Lankan (4.3%, a difference of 0.37%), Immigrants from Poland (4.3%, a difference of 0.40%), and Nigerian (4.2%, a difference of 0.49%).
| Demographics | Rating | Rank | Professional Degree |
| Scotch-Irish | 34.2 /100 | #186 | Fair 4.3% |
| Immigrants | Cameroon | 33.3 /100 | #187 | Fair 4.3% |
| Immigrants | Thailand | 31.7 /100 | #188 | Fair 4.3% |
| Slovaks | 30.7 /100 | #189 | Fair 4.3% |
| Immigrants | Poland | 29.2 /100 | #190 | Fair 4.3% |
| Sri Lankans | 29.0 /100 | #191 | Fair 4.3% |
| Ghanaians | 27.3 /100 | #192 | Fair 4.3% |
| French | 27.1 /100 | #193 | Fair 4.2% |
| Scandinavians | 25.8 /100 | #194 | Fair 4.2% |
| Nigerians | 24.6 /100 | #195 | Fair 4.2% |
| Spanish | 23.0 /100 | #196 | Fair 4.2% |
| Czechoslovakians | 22.4 /100 | #197 | Fair 4.2% |
| Immigrants | Middle Africa | 22.1 /100 | #198 | Fair 4.2% |
| Norwegians | 20.5 /100 | #199 | Fair 4.2% |
| Immigrants | North Macedonia | 20.2 /100 | #200 | Fair 4.2% |
Demographics Similar to Osage by Professional Degree
In terms of professional degree, the demographic groups most similar to Osage are Iroquois (3.7%, a difference of 0.10%), Tongan (3.7%, a difference of 0.43%), Bahamian (3.7%, a difference of 0.47%), Immigrants from St. Vincent and the Grenadines (3.7%, a difference of 0.54%), and Pueblo (3.7%, a difference of 0.57%).
| Demographics | Rating | Rank | Professional Degree |
| Hmong | 1.6 /100 | #248 | Tragic 3.7% |
| Immigrants | Grenada | 1.5 /100 | #249 | Tragic 3.7% |
| Immigrants | Fiji | 1.5 /100 | #250 | Tragic 3.7% |
| Immigrants | Nicaragua | 1.4 /100 | #251 | Tragic 3.7% |
| Jamaicans | 1.4 /100 | #252 | Tragic 3.7% |
| Pueblo | 1.4 /100 | #253 | Tragic 3.7% |
| Tongans | 1.3 /100 | #254 | Tragic 3.7% |
| Osage | 1.2 /100 | #255 | Tragic 3.7% |
| Iroquois | 1.2 /100 | #256 | Tragic 3.7% |
| Bahamians | 1.1 /100 | #257 | Tragic 3.7% |
| Immigrants | St. Vincent and the Grenadines | 1.1 /100 | #258 | Tragic 3.7% |
| Africans | 1.0 /100 | #259 | Tragic 3.7% |
| Indonesians | 1.0 /100 | #260 | Tragic 3.7% |
| Immigrants | Guyana | 1.0 /100 | #261 | Tragic 3.7% |
| U.S. Virgin Islanders | 1.0 /100 | #262 | Tragic 3.7% |