Immigrants from Poland vs Cape Verdean 8th Grade
COMPARE
Immigrants from Poland
Cape Verdean
8th Grade
8th Grade Comparison
Immigrants from Poland
Cape Verdeans
95.8%
8TH GRADE
61.1/ 100
METRIC RATING
166th/ 347
METRIC RANK
93.5%
8TH GRADE
0.0/ 100
METRIC RATING
312th/ 347
METRIC RANK
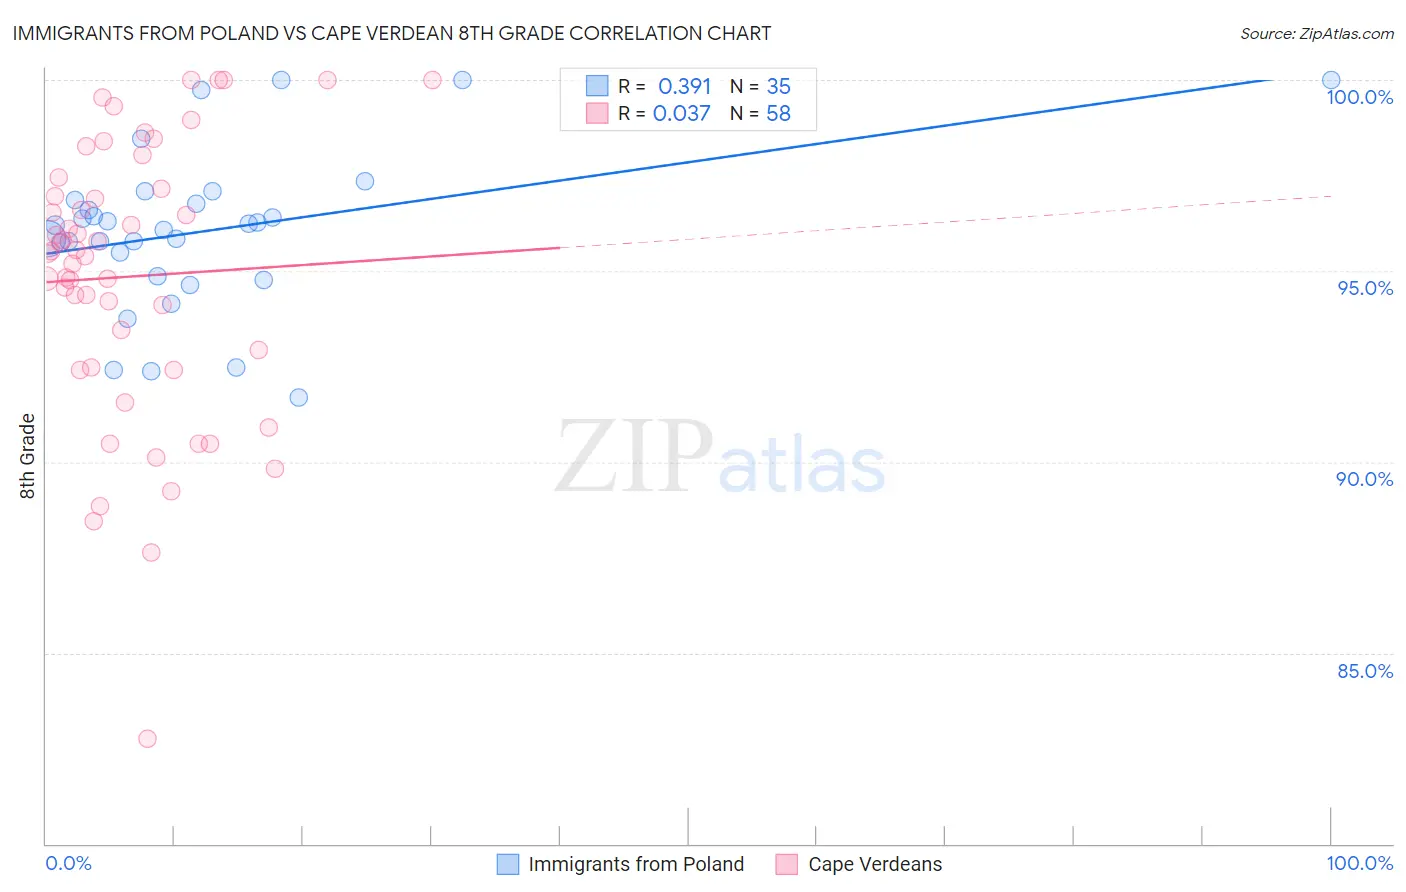
Immigrants from Poland vs Cape Verdean 8th Grade Correlation Chart
The statistical analysis conducted on geographies consisting of 304,861,877 people shows a mild positive correlation between the proportion of Immigrants from Poland and percentage of population with at least 8th grade education in the United States with a correlation coefficient (R) of 0.391 and weighted average of 95.8%. Similarly, the statistical analysis conducted on geographies consisting of 107,537,955 people shows no correlation between the proportion of Cape Verdeans and percentage of population with at least 8th grade education in the United States with a correlation coefficient (R) of 0.037 and weighted average of 93.5%, a difference of 2.4%.
8th Grade Correlation Summary
| Measurement | Immigrants from Poland | Cape Verdean |
| Minimum | 91.7% | 82.8% |
| Maximum | 100.0% | 100.0% |
| Range | 8.3% | 17.2% |
| Mean | 96.0% | 94.9% |
| Median | 96.2% | 95.5% |
| Interquartile 25% (IQ1) | 94.9% | 92.5% |
| Interquartile 75% (IQ3) | 96.9% | 97.2% |
| Interquartile Range (IQR) | 2.0% | 4.7% |
| Standard Deviation (Sample) | 2.1% | 3.6% |
| Standard Deviation (Population) | 2.0% | 3.6% |
Similar Demographics by 8th Grade
Demographics Similar to Immigrants from Poland by 8th Grade
In terms of 8th grade, the demographic groups most similar to Immigrants from Poland are Alsatian (95.8%, a difference of 0.0%), Spaniard (95.8%, a difference of 0.010%), Immigrants from Ukraine (95.8%, a difference of 0.010%), Immigrants from Sri Lanka (95.8%, a difference of 0.020%), and Immigrants from Italy (95.8%, a difference of 0.020%).
| Demographics | Rating | Rank | 8th Grade |
| Immigrants | Kazakhstan | 68.4 /100 | #159 | Good 95.9% |
| Seminole | 67.7 /100 | #160 | Good 95.8% |
| Bermudans | 67.5 /100 | #161 | Good 95.8% |
| Immigrants | Kenya | 67.2 /100 | #162 | Good 95.8% |
| Immigrants | Sri Lanka | 64.1 /100 | #163 | Good 95.8% |
| Immigrants | Italy | 63.5 /100 | #164 | Good 95.8% |
| Alsatians | 61.4 /100 | #165 | Good 95.8% |
| Immigrants | Poland | 61.1 /100 | #166 | Good 95.8% |
| Spaniards | 60.0 /100 | #167 | Good 95.8% |
| Immigrants | Ukraine | 59.5 /100 | #168 | Average 95.8% |
| Immigrants | Iran | 58.6 /100 | #169 | Average 95.8% |
| Ute | 58.5 /100 | #170 | Average 95.8% |
| Egyptians | 58.2 /100 | #171 | Average 95.8% |
| Immigrants | Korea | 57.9 /100 | #172 | Average 95.8% |
| Mongolians | 53.0 /100 | #173 | Average 95.8% |
Demographics Similar to Cape Verdeans by 8th Grade
In terms of 8th grade, the demographic groups most similar to Cape Verdeans are Immigrants from Caribbean (93.5%, a difference of 0.030%), Japanese (93.6%, a difference of 0.040%), Immigrants from Bangladesh (93.6%, a difference of 0.040%), Immigrants from Vietnam (93.5%, a difference of 0.040%), and Immigrants (93.6%, a difference of 0.050%).
| Demographics | Rating | Rank | 8th Grade |
| Immigrants | Haiti | 0.0 /100 | #305 | Tragic 93.9% |
| Immigrants | Guyana | 0.0 /100 | #306 | Tragic 93.8% |
| Immigrants | Portugal | 0.0 /100 | #307 | Tragic 93.8% |
| Ecuadorians | 0.0 /100 | #308 | Tragic 93.6% |
| Immigrants | Immigrants | 0.0 /100 | #309 | Tragic 93.6% |
| Japanese | 0.0 /100 | #310 | Tragic 93.6% |
| Immigrants | Bangladesh | 0.0 /100 | #311 | Tragic 93.6% |
| Cape Verdeans | 0.0 /100 | #312 | Tragic 93.5% |
| Immigrants | Caribbean | 0.0 /100 | #313 | Tragic 93.5% |
| Immigrants | Vietnam | 0.0 /100 | #314 | Tragic 93.5% |
| Vietnamese | 0.0 /100 | #315 | Tragic 93.5% |
| Immigrants | Cambodia | 0.0 /100 | #316 | Tragic 93.3% |
| Immigrants | Ecuador | 0.0 /100 | #317 | Tragic 93.3% |
| Puerto Ricans | 0.0 /100 | #318 | Tragic 93.2% |
| Immigrants | Cuba | 0.0 /100 | #319 | Tragic 93.2% |