Turkish vs Immigrants from Laos Unemployment Among Ages 45 to 54 years
COMPARE
Turkish
Immigrants from Laos
Unemployment Among Ages 45 to 54 years
Unemployment Among Ages 45 to 54 years Comparison
Turks
Immigrants from Laos
4.3%
UNEMPLOYMENT AMONG AGES 45 TO 54 YEARS
98.9/ 100
METRIC RATING
66th/ 347
METRIC RANK
4.6%
UNEMPLOYMENT AMONG AGES 45 TO 54 YEARS
35.7/ 100
METRIC RATING
189th/ 347
METRIC RANK
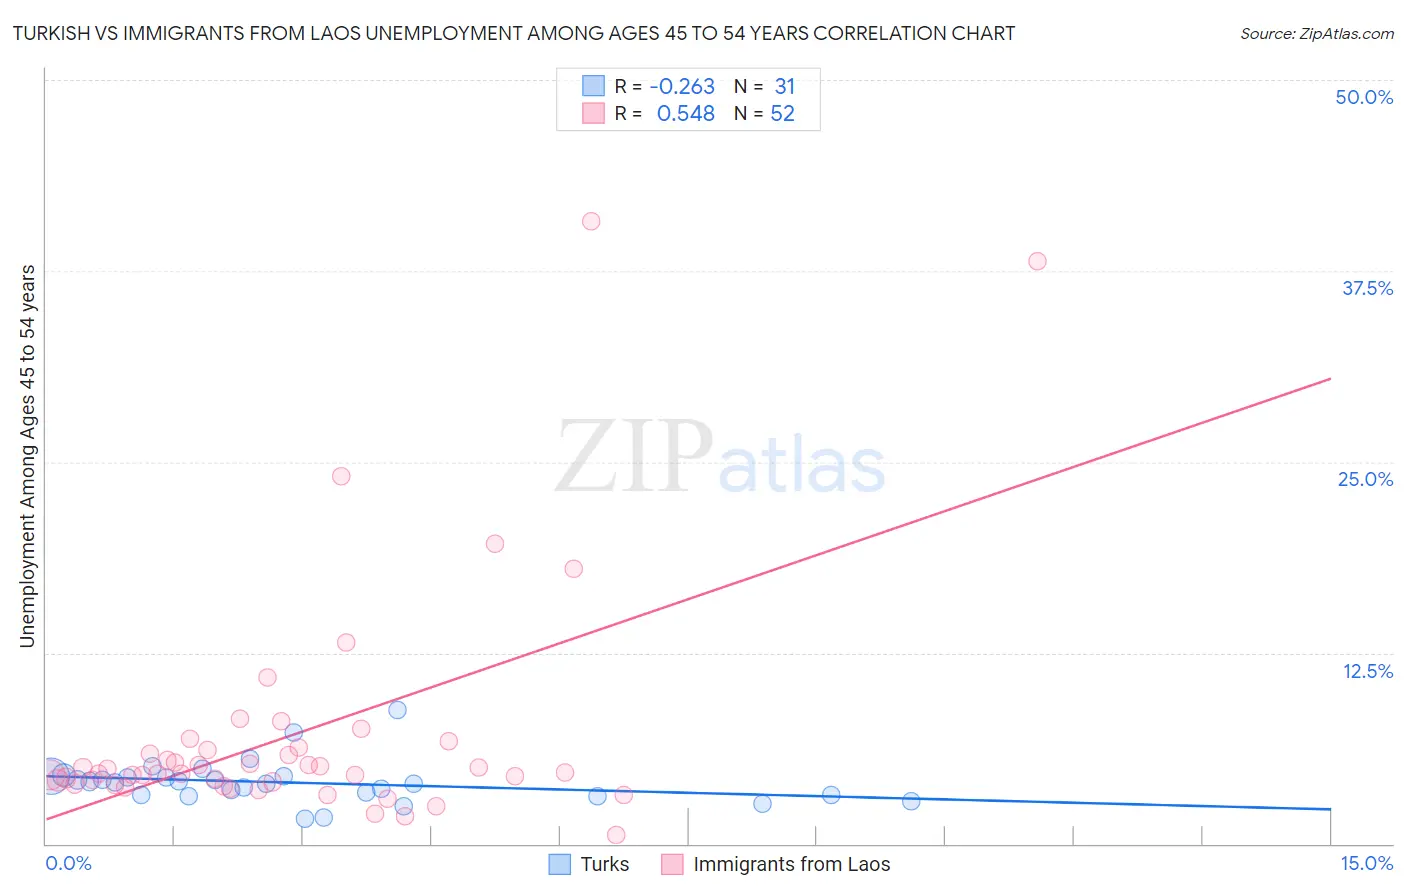
Turkish vs Immigrants from Laos Unemployment Among Ages 45 to 54 years Correlation Chart
The statistical analysis conducted on geographies consisting of 267,961,634 people shows a weak negative correlation between the proportion of Turks and unemployment rate among population between the ages 45 and 54 in the United States with a correlation coefficient (R) of -0.263 and weighted average of 4.3%. Similarly, the statistical analysis conducted on geographies consisting of 199,151,813 people shows a substantial positive correlation between the proportion of Immigrants from Laos and unemployment rate among population between the ages 45 and 54 in the United States with a correlation coefficient (R) of 0.548 and weighted average of 4.6%, a difference of 6.3%.
Unemployment Among Ages 45 to 54 years Correlation Summary
| Measurement | Turkish | Immigrants from Laos |
| Minimum | 1.7% | 0.60% |
| Maximum | 8.7% | 40.7% |
| Range | 7.1% | 40.1% |
| Mean | 4.0% | 7.2% |
| Median | 4.0% | 4.6% |
| Interquartile 25% (IQ1) | 3.2% | 4.0% |
| Interquartile 75% (IQ3) | 4.4% | 6.2% |
| Interquartile Range (IQR) | 1.2% | 2.2% |
| Standard Deviation (Sample) | 1.4% | 7.8% |
| Standard Deviation (Population) | 1.4% | 7.7% |
Similar Demographics by Unemployment Among Ages 45 to 54 years
Demographics Similar to Turks by Unemployment Among Ages 45 to 54 years
In terms of unemployment among ages 45 to 54 years, the demographic groups most similar to Turks are Immigrants from Nepal (4.3%, a difference of 0.020%), Immigrants from Sudan (4.3%, a difference of 0.040%), Austrian (4.3%, a difference of 0.070%), Slovak (4.3%, a difference of 0.10%), and Pennsylvania German (4.3%, a difference of 0.17%).
| Demographics | Rating | Rank | Unemployment Among Ages 45 to 54 years |
| Okinawans | 99.2 /100 | #59 | Exceptional 4.3% |
| Immigrants | Korea | 99.2 /100 | #60 | Exceptional 4.3% |
| Immigrants | Pakistan | 99.2 /100 | #61 | Exceptional 4.3% |
| Lithuanians | 99.1 /100 | #62 | Exceptional 4.3% |
| Pennsylvania Germans | 99.1 /100 | #63 | Exceptional 4.3% |
| Austrians | 99.0 /100 | #64 | Exceptional 4.3% |
| Immigrants | Sudan | 99.0 /100 | #65 | Exceptional 4.3% |
| Turks | 98.9 /100 | #66 | Exceptional 4.3% |
| Immigrants | Nepal | 98.9 /100 | #67 | Exceptional 4.3% |
| Slovaks | 98.8 /100 | #68 | Exceptional 4.3% |
| Immigrants | Japan | 98.7 /100 | #69 | Exceptional 4.3% |
| Paraguayans | 98.6 /100 | #70 | Exceptional 4.3% |
| Palestinians | 98.5 /100 | #71 | Exceptional 4.3% |
| Whites/Caucasians | 98.4 /100 | #72 | Exceptional 4.3% |
| Canadians | 98.2 /100 | #73 | Exceptional 4.3% |
Demographics Similar to Immigrants from Laos by Unemployment Among Ages 45 to 54 years
In terms of unemployment among ages 45 to 54 years, the demographic groups most similar to Immigrants from Laos are Immigrants from Sierra Leone (4.6%, a difference of 0.030%), Immigrants from Serbia (4.6%, a difference of 0.040%), Immigrants from Ukraine (4.5%, a difference of 0.060%), Immigrants from Uruguay (4.6%, a difference of 0.070%), and Immigrants from Thailand (4.6%, a difference of 0.080%).
| Demographics | Rating | Rank | Unemployment Among Ages 45 to 54 years |
| Immigrants | China | 46.7 /100 | #182 | Average 4.5% |
| Sierra Leoneans | 46.7 /100 | #183 | Average 4.5% |
| Immigrants | Hong Kong | 45.9 /100 | #184 | Average 4.5% |
| Immigrants | Philippines | 41.0 /100 | #185 | Average 4.5% |
| Hawaiians | 39.1 /100 | #186 | Fair 4.5% |
| Immigrants | Ukraine | 36.8 /100 | #187 | Fair 4.5% |
| Immigrants | Sierra Leone | 36.3 /100 | #188 | Fair 4.6% |
| Immigrants | Laos | 35.7 /100 | #189 | Fair 4.6% |
| Immigrants | Serbia | 34.8 /100 | #190 | Fair 4.6% |
| Immigrants | Uruguay | 34.4 /100 | #191 | Fair 4.6% |
| Immigrants | Thailand | 34.1 /100 | #192 | Fair 4.6% |
| Immigrants | Lithuania | 33.2 /100 | #193 | Fair 4.6% |
| South Americans | 32.9 /100 | #194 | Fair 4.6% |
| Peruvians | 31.5 /100 | #195 | Fair 4.6% |
| Estonians | 31.2 /100 | #196 | Fair 4.6% |