Tohono O'odham vs Immigrants from Laos Bachelor's Degree
COMPARE
Tohono O'odham
Immigrants from Laos
Bachelor's Degree
Bachelor's Degree Comparison
Tohono O'odham
Immigrants from Laos
24.4%
BACHELOR'S DEGREE
0.0/ 100
METRIC RATING
343rd/ 347
METRIC RANK
31.6%
BACHELOR'S DEGREE
0.1/ 100
METRIC RATING
280th/ 347
METRIC RANK
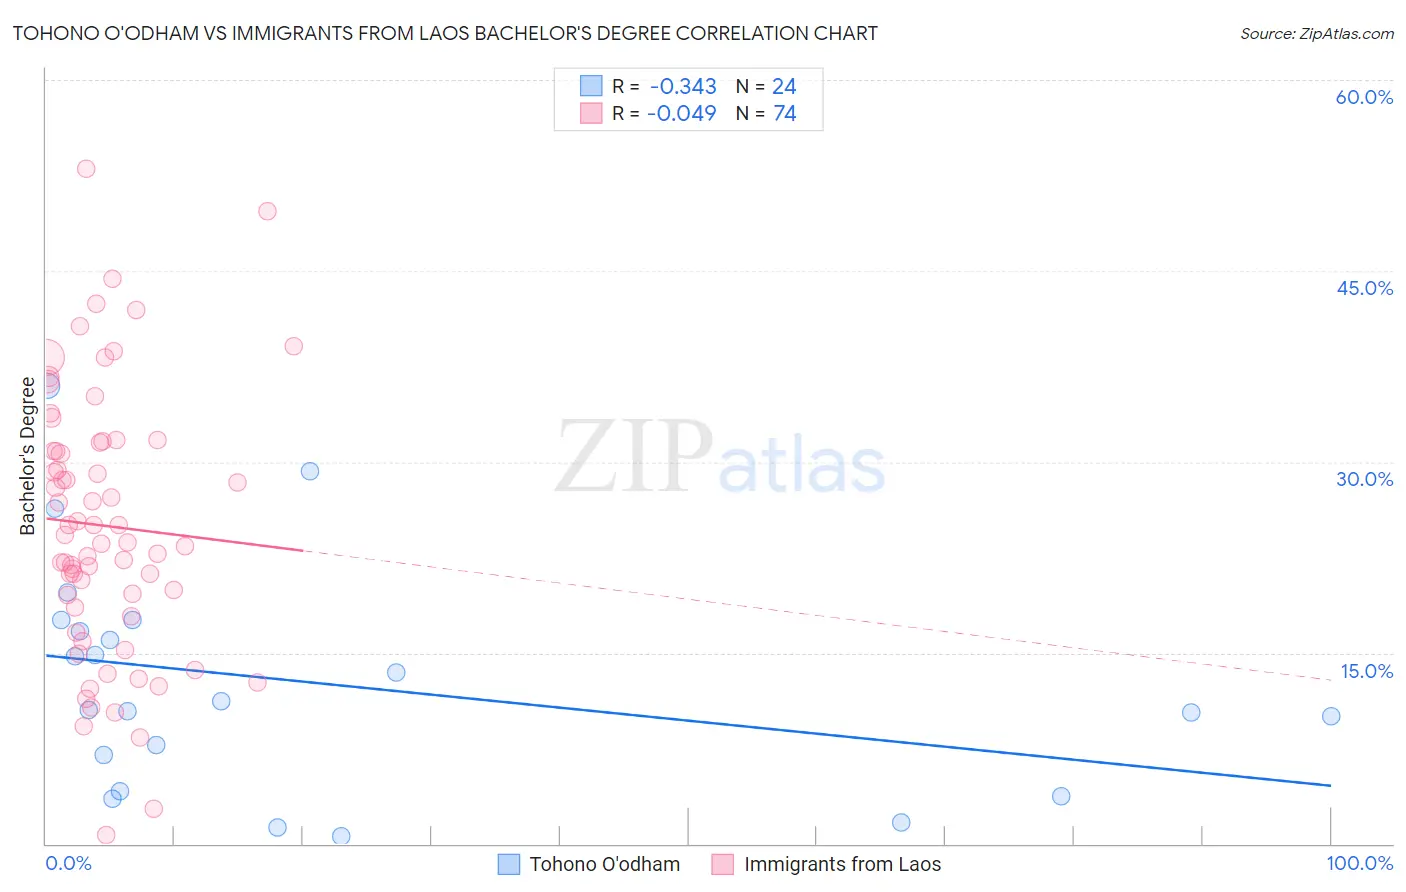
Tohono O'odham vs Immigrants from Laos Bachelor's Degree Correlation Chart
The statistical analysis conducted on geographies consisting of 58,724,509 people shows a mild negative correlation between the proportion of Tohono O'odham and percentage of population with at least bachelor's degree education in the United States with a correlation coefficient (R) of -0.343 and weighted average of 24.4%. Similarly, the statistical analysis conducted on geographies consisting of 201,474,630 people shows no correlation between the proportion of Immigrants from Laos and percentage of population with at least bachelor's degree education in the United States with a correlation coefficient (R) of -0.049 and weighted average of 31.6%, a difference of 29.5%.
Bachelor's Degree Correlation Summary
| Measurement | Tohono O'odham | Immigrants from Laos |
| Minimum | 0.61% | 0.64% |
| Maximum | 36.0% | 53.0% |
| Range | 35.4% | 52.4% |
| Mean | 12.7% | 25.0% |
| Median | 10.8% | 24.0% |
| Interquartile 25% (IQ1) | 5.5% | 18.6% |
| Interquartile 75% (IQ3) | 17.1% | 31.5% |
| Interquartile Range (IQR) | 11.6% | 12.9% |
| Standard Deviation (Sample) | 9.0% | 10.5% |
| Standard Deviation (Population) | 8.8% | 10.4% |
Similar Demographics by Bachelor's Degree
Demographics Similar to Tohono O'odham by Bachelor's Degree
In terms of bachelor's degree, the demographic groups most similar to Tohono O'odham are Yakama (24.5%, a difference of 0.20%), Yuman (24.5%, a difference of 0.47%), Lumbee (24.8%, a difference of 1.4%), Navajo (23.6%, a difference of 3.4%), and Hopi (25.3%, a difference of 3.6%).
| Demographics | Rating | Rank | Bachelor's Degree |
| Mexicans | 0.0 /100 | #333 | Tragic 27.1% |
| Arapaho | 0.0 /100 | #334 | Tragic 26.6% |
| Natives/Alaskans | 0.0 /100 | #335 | Tragic 26.3% |
| Immigrants | Mexico | 0.0 /100 | #336 | Tragic 26.1% |
| Inupiat | 0.0 /100 | #337 | Tragic 25.8% |
| Pueblo | 0.0 /100 | #338 | Tragic 25.5% |
| Hopi | 0.0 /100 | #339 | Tragic 25.3% |
| Lumbee | 0.0 /100 | #340 | Tragic 24.8% |
| Yuman | 0.0 /100 | #341 | Tragic 24.5% |
| Yakama | 0.0 /100 | #342 | Tragic 24.5% |
| Tohono O'odham | 0.0 /100 | #343 | Tragic 24.4% |
| Navajo | 0.0 /100 | #344 | Tragic 23.6% |
| Pima | 0.0 /100 | #345 | Tragic 23.2% |
| Houma | 0.0 /100 | #346 | Tragic 21.4% |
| Yup'ik | 0.0 /100 | #347 | Tragic 19.4% |
Demographics Similar to Immigrants from Laos by Bachelor's Degree
In terms of bachelor's degree, the demographic groups most similar to Immigrants from Laos are Hawaiian (31.6%, a difference of 0.050%), Marshallese (31.7%, a difference of 0.40%), Dominican (31.8%, a difference of 0.45%), Blackfeet (31.5%, a difference of 0.46%), and Salvadoran (31.8%, a difference of 0.60%).
| Demographics | Rating | Rank | Bachelor's Degree |
| Americans | 0.2 /100 | #273 | Tragic 31.9% |
| Potawatomi | 0.2 /100 | #274 | Tragic 31.9% |
| Samoans | 0.1 /100 | #275 | Tragic 31.8% |
| Salvadorans | 0.1 /100 | #276 | Tragic 31.8% |
| Dominicans | 0.1 /100 | #277 | Tragic 31.8% |
| Marshallese | 0.1 /100 | #278 | Tragic 31.7% |
| Hawaiians | 0.1 /100 | #279 | Tragic 31.6% |
| Immigrants | Laos | 0.1 /100 | #280 | Tragic 31.6% |
| Blackfeet | 0.1 /100 | #281 | Tragic 31.5% |
| Immigrants | Caribbean | 0.1 /100 | #282 | Tragic 31.4% |
| Hondurans | 0.1 /100 | #283 | Tragic 31.3% |
| Haitians | 0.1 /100 | #284 | Tragic 31.3% |
| Aleuts | 0.1 /100 | #285 | Tragic 31.3% |
| Immigrants | El Salvador | 0.1 /100 | #286 | Tragic 31.3% |
| Ottawa | 0.1 /100 | #287 | Tragic 31.1% |