Iroquois vs Immigrants from Congo 10th Grade
COMPARE
Iroquois
Immigrants from Congo
10th Grade
10th Grade Comparison
Iroquois
Immigrants from Congo
94.3%
10TH GRADE
92.8/ 100
METRIC RATING
129th/ 347
METRIC RANK
92.4%
10TH GRADE
0.2/ 100
METRIC RATING
274th/ 347
METRIC RANK
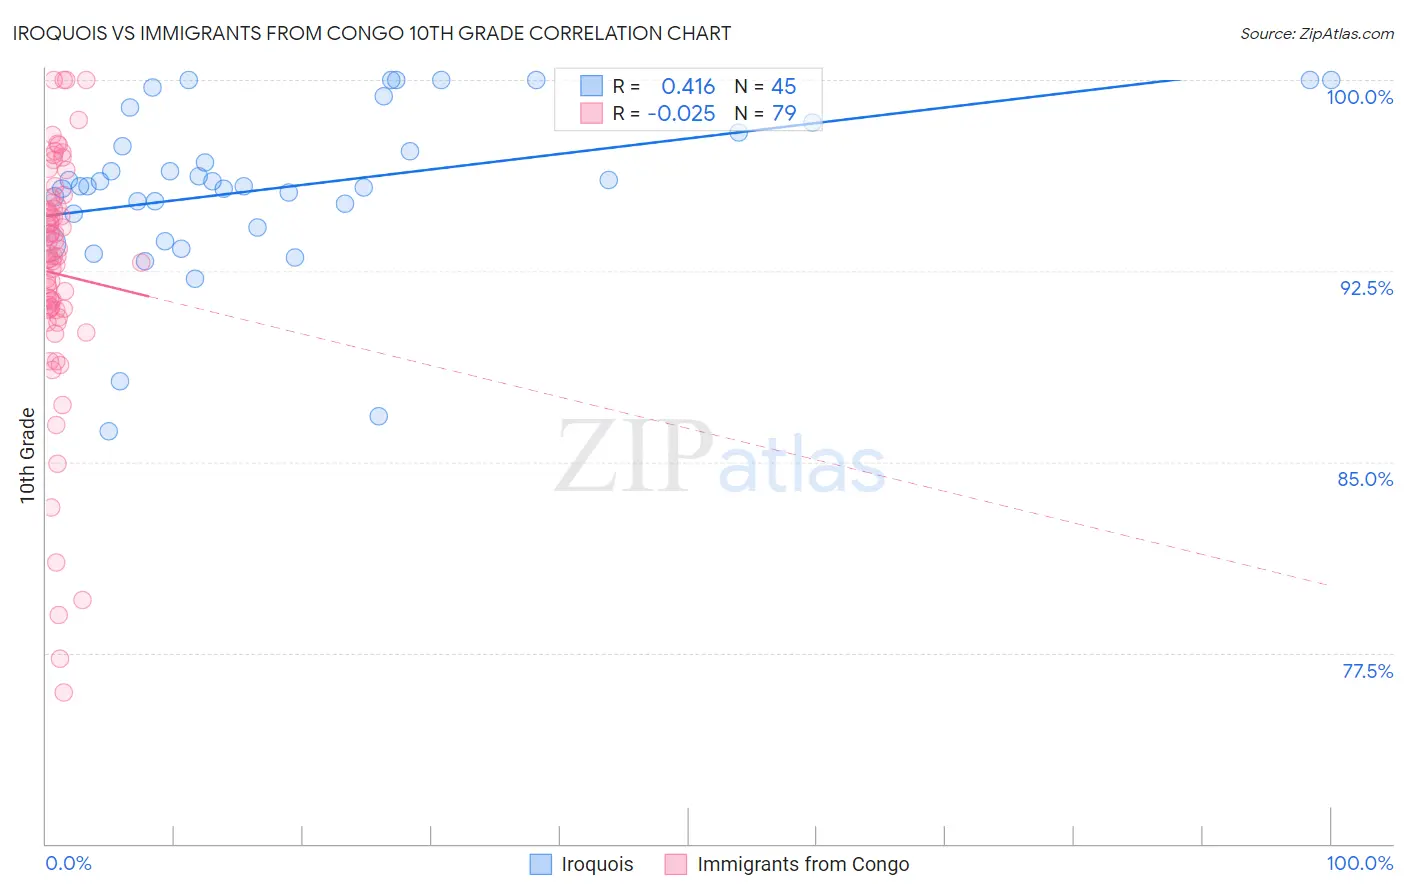
Iroquois vs Immigrants from Congo 10th Grade Correlation Chart
The statistical analysis conducted on geographies consisting of 207,308,712 people shows a moderate positive correlation between the proportion of Iroquois and percentage of population with at least 10th grade education in the United States with a correlation coefficient (R) of 0.416 and weighted average of 94.3%. Similarly, the statistical analysis conducted on geographies consisting of 92,131,505 people shows no correlation between the proportion of Immigrants from Congo and percentage of population with at least 10th grade education in the United States with a correlation coefficient (R) of -0.025 and weighted average of 92.4%, a difference of 2.0%.
10th Grade Correlation Summary
| Measurement | Iroquois | Immigrants from Congo |
| Minimum | 86.2% | 75.9% |
| Maximum | 100.0% | 100.0% |
| Range | 13.8% | 24.1% |
| Mean | 95.8% | 92.4% |
| Median | 95.8% | 93.1% |
| Interquartile 25% (IQ1) | 94.5% | 91.0% |
| Interquartile 75% (IQ3) | 98.1% | 95.1% |
| Interquartile Range (IQR) | 3.6% | 4.1% |
| Standard Deviation (Sample) | 3.3% | 4.9% |
| Standard Deviation (Population) | 3.2% | 4.9% |
Similar Demographics by 10th Grade
Demographics Similar to Iroquois by 10th Grade
In terms of 10th grade, the demographic groups most similar to Iroquois are Immigrants from Greece (94.3%, a difference of 0.0%), Immigrants from Eastern Europe (94.3%, a difference of 0.010%), Immigrants from Russia (94.3%, a difference of 0.010%), Potawatomi (94.3%, a difference of 0.030%), and Creek (94.2%, a difference of 0.030%).
| Demographics | Rating | Rank | 10th Grade |
| Inupiat | 95.1 /100 | #122 | Exceptional 94.4% |
| Cree | 95.1 /100 | #123 | Exceptional 94.4% |
| Basques | 94.9 /100 | #124 | Exceptional 94.3% |
| Americans | 94.4 /100 | #125 | Exceptional 94.3% |
| Immigrants | Iran | 94.4 /100 | #126 | Exceptional 94.3% |
| Israelis | 93.8 /100 | #127 | Exceptional 94.3% |
| Potawatomi | 93.6 /100 | #128 | Exceptional 94.3% |
| Iroquois | 92.8 /100 | #129 | Exceptional 94.3% |
| Immigrants | Greece | 92.7 /100 | #130 | Exceptional 94.3% |
| Immigrants | Eastern Europe | 92.5 /100 | #131 | Exceptional 94.3% |
| Immigrants | Russia | 92.4 /100 | #132 | Exceptional 94.3% |
| Creek | 91.9 /100 | #133 | Exceptional 94.2% |
| Osage | 91.7 /100 | #134 | Exceptional 94.2% |
| Immigrants | Korea | 91.3 /100 | #135 | Exceptional 94.2% |
| Shoshone | 90.8 /100 | #136 | Exceptional 94.2% |
Demographics Similar to Immigrants from Congo by 10th Grade
In terms of 10th grade, the demographic groups most similar to Immigrants from Congo are West Indian (92.4%, a difference of 0.0%), Trinidadian and Tobagonian (92.4%, a difference of 0.010%), Immigrants from Western Africa (92.5%, a difference of 0.080%), Immigrants from Eritrea (92.5%, a difference of 0.090%), and Immigrants from Colombia (92.5%, a difference of 0.10%).
| Demographics | Rating | Rank | 10th Grade |
| Taiwanese | 0.3 /100 | #267 | Tragic 92.5% |
| Immigrants | Ghana | 0.3 /100 | #268 | Tragic 92.5% |
| Immigrants | Colombia | 0.3 /100 | #269 | Tragic 92.5% |
| Immigrants | Uruguay | 0.3 /100 | #270 | Tragic 92.5% |
| Immigrants | Eritrea | 0.3 /100 | #271 | Tragic 92.5% |
| Immigrants | Western Africa | 0.3 /100 | #272 | Tragic 92.5% |
| Trinidadians and Tobagonians | 0.2 /100 | #273 | Tragic 92.4% |
| Immigrants | Congo | 0.2 /100 | #274 | Tragic 92.4% |
| West Indians | 0.2 /100 | #275 | Tragic 92.4% |
| Immigrants | Trinidad and Tobago | 0.1 /100 | #276 | Tragic 92.3% |
| Navajo | 0.1 /100 | #277 | Tragic 92.3% |
| Barbadians | 0.1 /100 | #278 | Tragic 92.2% |
| Natives/Alaskans | 0.1 /100 | #279 | Tragic 92.2% |
| Malaysians | 0.1 /100 | #280 | Tragic 92.2% |
| Bangladeshis | 0.1 /100 | #281 | Tragic 92.2% |