Turkish vs Alsatian 6th Grade
COMPARE
Turkish
Alsatian
6th Grade
6th Grade Comparison
Turks
Alsatians
97.5%
6TH GRADE
98.3/ 100
METRIC RATING
100th/ 347
METRIC RANK
97.1%
6TH GRADE
69.8/ 100
METRIC RATING
156th/ 347
METRIC RANK
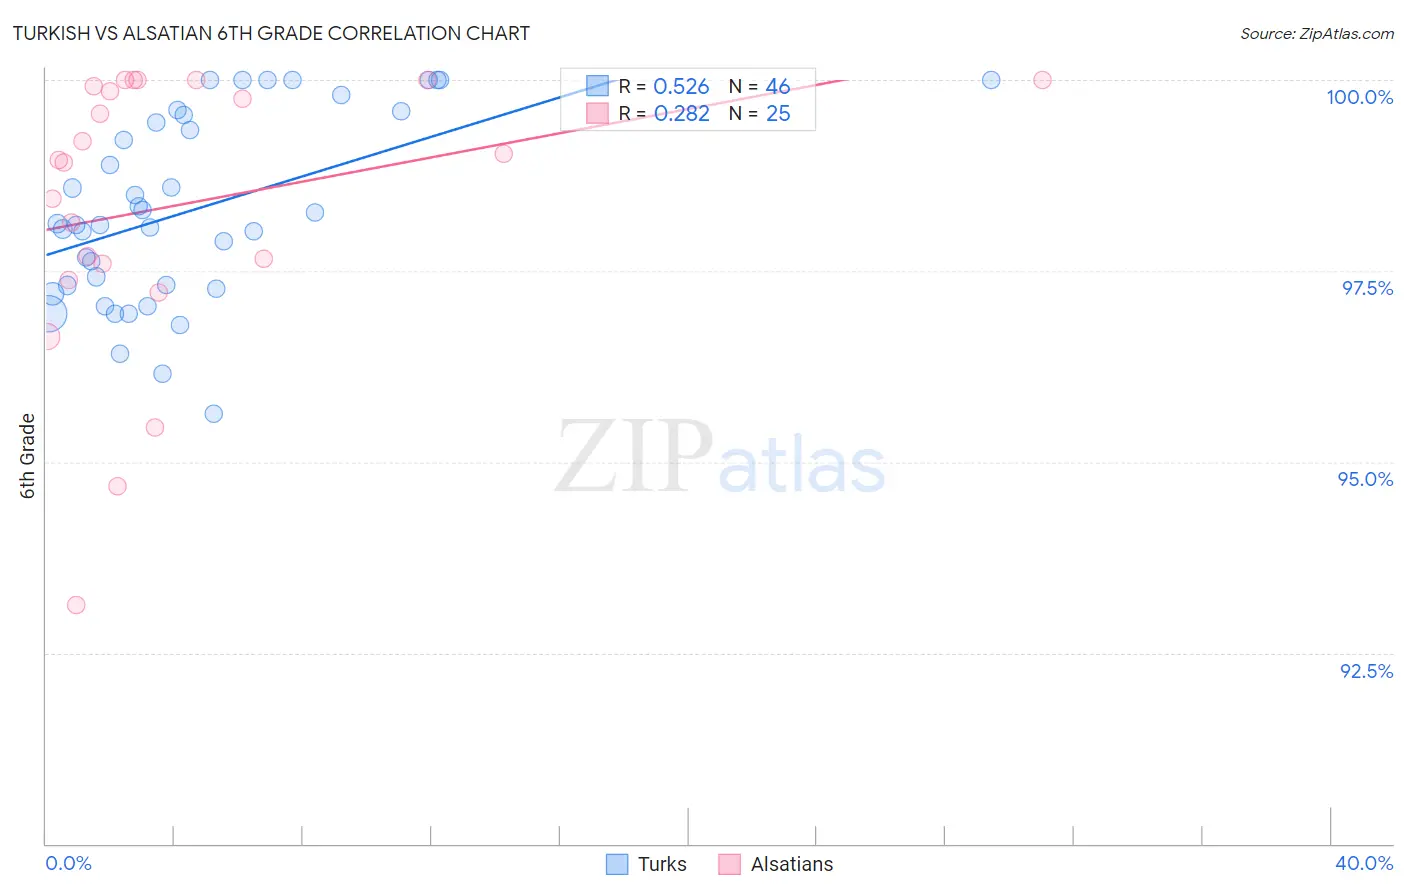
Turkish vs Alsatian 6th Grade Correlation Chart
The statistical analysis conducted on geographies consisting of 271,858,657 people shows a substantial positive correlation between the proportion of Turks and percentage of population with at least 6th grade education in the United States with a correlation coefficient (R) of 0.526 and weighted average of 97.5%. Similarly, the statistical analysis conducted on geographies consisting of 82,682,365 people shows a weak positive correlation between the proportion of Alsatians and percentage of population with at least 6th grade education in the United States with a correlation coefficient (R) of 0.282 and weighted average of 97.1%, a difference of 0.36%.
6th Grade Correlation Summary
| Measurement | Turkish | Alsatian |
| Minimum | 95.6% | 93.1% |
| Maximum | 100.0% | 100.0% |
| Range | 4.4% | 6.9% |
| Mean | 98.3% | 98.4% |
| Median | 98.1% | 98.9% |
| Interquartile 25% (IQ1) | 97.3% | 97.5% |
| Interquartile 75% (IQ3) | 99.5% | 100.0% |
| Interquartile Range (IQR) | 2.2% | 2.5% |
| Standard Deviation (Sample) | 1.2% | 1.8% |
| Standard Deviation (Population) | 1.2% | 1.8% |
Similar Demographics by 6th Grade
Demographics Similar to Turks by 6th Grade
In terms of 6th grade, the demographic groups most similar to Turks are South African (97.5%, a difference of 0.0%), Immigrants from Denmark (97.5%, a difference of 0.020%), Yugoslavian (97.5%, a difference of 0.020%), Choctaw (97.5%, a difference of 0.020%), and Bhutanese (97.5%, a difference of 0.020%).
| Demographics | Rating | Rank | 6th Grade |
| Cree | 98.7 /100 | #93 | Exceptional 97.5% |
| Cypriots | 98.7 /100 | #94 | Exceptional 97.5% |
| Immigrants | Ireland | 98.7 /100 | #95 | Exceptional 97.5% |
| Immigrants | Germany | 98.6 /100 | #96 | Exceptional 97.5% |
| Immigrants | Sweden | 98.6 /100 | #97 | Exceptional 97.5% |
| Immigrants | Denmark | 98.5 /100 | #98 | Exceptional 97.5% |
| Yugoslavians | 98.5 /100 | #99 | Exceptional 97.5% |
| Turks | 98.3 /100 | #100 | Exceptional 97.5% |
| South Africans | 98.2 /100 | #101 | Exceptional 97.5% |
| Choctaw | 98.0 /100 | #102 | Exceptional 97.5% |
| Bhutanese | 98.0 /100 | #103 | Exceptional 97.5% |
| German Russians | 97.9 /100 | #104 | Exceptional 97.5% |
| Cheyenne | 97.9 /100 | #105 | Exceptional 97.5% |
| Menominee | 97.7 /100 | #106 | Exceptional 97.5% |
| Immigrants | Singapore | 97.6 /100 | #107 | Exceptional 97.5% |
Demographics Similar to Alsatians by 6th Grade
In terms of 6th grade, the demographic groups most similar to Alsatians are Soviet Union (97.2%, a difference of 0.010%), Ute (97.1%, a difference of 0.010%), Immigrants from Russia (97.1%, a difference of 0.010%), French American Indian (97.2%, a difference of 0.020%), and Immigrants from Jordan (97.2%, a difference of 0.020%).
| Demographics | Rating | Rank | 6th Grade |
| Immigrants | Israel | 76.0 /100 | #149 | Good 97.2% |
| Immigrants | Bosnia and Herzegovina | 74.8 /100 | #150 | Good 97.2% |
| French American Indians | 74.0 /100 | #151 | Good 97.2% |
| Immigrants | Jordan | 73.0 /100 | #152 | Good 97.2% |
| Immigrants | Eastern Europe | 72.6 /100 | #153 | Good 97.2% |
| Soviet Union | 71.5 /100 | #154 | Good 97.2% |
| Ute | 71.1 /100 | #155 | Good 97.1% |
| Alsatians | 69.8 /100 | #156 | Good 97.1% |
| Immigrants | Russia | 67.6 /100 | #157 | Good 97.1% |
| Immigrants | Iran | 63.3 /100 | #158 | Good 97.1% |
| Kenyans | 62.9 /100 | #159 | Good 97.1% |
| Ugandans | 62.2 /100 | #160 | Good 97.1% |
| Immigrants | Belarus | 60.4 /100 | #161 | Good 97.1% |
| Marshallese | 60.2 /100 | #162 | Good 97.1% |
| Albanians | 57.8 /100 | #163 | Average 97.1% |