Asian vs Alsatian 6th Grade
COMPARE
Asian
Alsatian
6th Grade
6th Grade Comparison
Asians
Alsatians
96.6%
6TH GRADE
2.4/ 100
METRIC RATING
235th/ 347
METRIC RANK
97.1%
6TH GRADE
69.8/ 100
METRIC RATING
156th/ 347
METRIC RANK
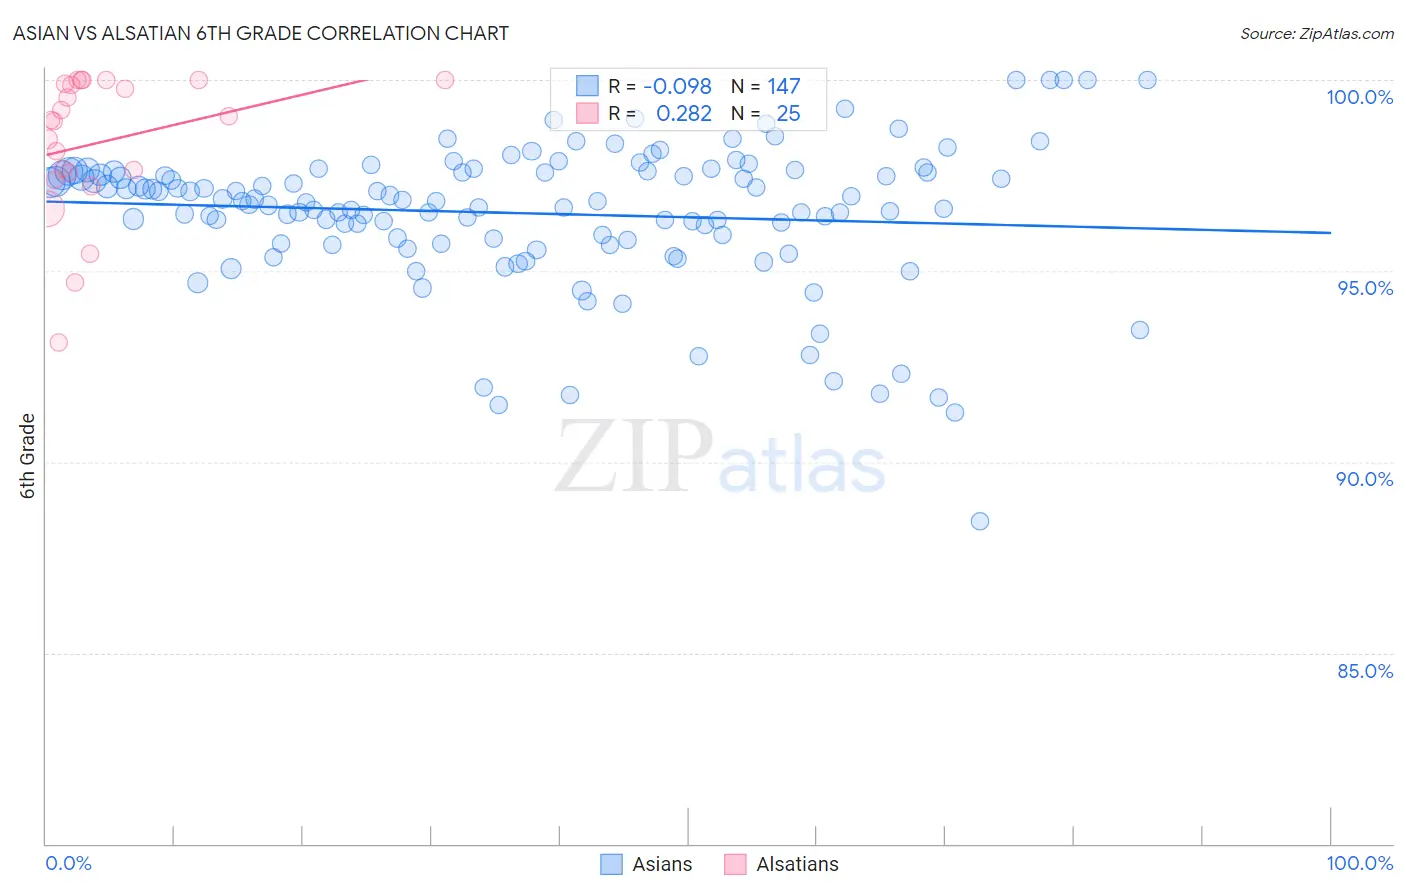
Asian vs Alsatian 6th Grade Correlation Chart
The statistical analysis conducted on geographies consisting of 550,801,467 people shows a slight negative correlation between the proportion of Asians and percentage of population with at least 6th grade education in the United States with a correlation coefficient (R) of -0.098 and weighted average of 96.6%. Similarly, the statistical analysis conducted on geographies consisting of 82,682,365 people shows a weak positive correlation between the proportion of Alsatians and percentage of population with at least 6th grade education in the United States with a correlation coefficient (R) of 0.282 and weighted average of 97.1%, a difference of 0.52%.
6th Grade Correlation Summary
| Measurement | Asian | Alsatian |
| Minimum | 88.5% | 93.1% |
| Maximum | 100.0% | 100.0% |
| Range | 11.5% | 6.9% |
| Mean | 96.5% | 98.4% |
| Median | 96.8% | 98.9% |
| Interquartile 25% (IQ1) | 95.8% | 97.5% |
| Interquartile 75% (IQ3) | 97.6% | 100.0% |
| Interquartile Range (IQR) | 1.8% | 2.5% |
| Standard Deviation (Sample) | 1.9% | 1.8% |
| Standard Deviation (Population) | 1.9% | 1.8% |
Similar Demographics by 6th Grade
Demographics Similar to Asians by 6th Grade
In terms of 6th grade, the demographic groups most similar to Asians are Uruguayan (96.6%, a difference of 0.0%), Immigrants from Indonesia (96.6%, a difference of 0.010%), Immigrants from Eastern Africa (96.6%, a difference of 0.020%), Yuman (96.7%, a difference of 0.030%), and Nigerian (96.6%, a difference of 0.030%).
| Demographics | Rating | Rank | 6th Grade |
| Immigrants | Malaysia | 4.0 /100 | #228 | Tragic 96.7% |
| Assyrians/Chaldeans/Syriacs | 4.0 /100 | #229 | Tragic 96.7% |
| Immigrants | Eastern Asia | 4.0 /100 | #230 | Tragic 96.7% |
| Sub-Saharan Africans | 3.5 /100 | #231 | Tragic 96.7% |
| South American Indians | 3.5 /100 | #232 | Tragic 96.7% |
| Yuman | 3.2 /100 | #233 | Tragic 96.7% |
| Uruguayans | 2.5 /100 | #234 | Tragic 96.6% |
| Asians | 2.4 /100 | #235 | Tragic 96.6% |
| Immigrants | Indonesia | 2.3 /100 | #236 | Tragic 96.6% |
| Immigrants | Eastern Africa | 2.0 /100 | #237 | Tragic 96.6% |
| Nigerians | 1.9 /100 | #238 | Tragic 96.6% |
| Indians (Asian) | 1.9 /100 | #239 | Tragic 96.6% |
| Koreans | 1.9 /100 | #240 | Tragic 96.6% |
| Senegalese | 1.8 /100 | #241 | Tragic 96.6% |
| Immigrants | Asia | 1.8 /100 | #242 | Tragic 96.6% |
Demographics Similar to Alsatians by 6th Grade
In terms of 6th grade, the demographic groups most similar to Alsatians are Soviet Union (97.2%, a difference of 0.010%), Ute (97.1%, a difference of 0.010%), Immigrants from Russia (97.1%, a difference of 0.010%), French American Indian (97.2%, a difference of 0.020%), and Immigrants from Jordan (97.2%, a difference of 0.020%).
| Demographics | Rating | Rank | 6th Grade |
| Immigrants | Israel | 76.0 /100 | #149 | Good 97.2% |
| Immigrants | Bosnia and Herzegovina | 74.8 /100 | #150 | Good 97.2% |
| French American Indians | 74.0 /100 | #151 | Good 97.2% |
| Immigrants | Jordan | 73.0 /100 | #152 | Good 97.2% |
| Immigrants | Eastern Europe | 72.6 /100 | #153 | Good 97.2% |
| Soviet Union | 71.5 /100 | #154 | Good 97.2% |
| Ute | 71.1 /100 | #155 | Good 97.1% |
| Alsatians | 69.8 /100 | #156 | Good 97.1% |
| Immigrants | Russia | 67.6 /100 | #157 | Good 97.1% |
| Immigrants | Iran | 63.3 /100 | #158 | Good 97.1% |
| Kenyans | 62.9 /100 | #159 | Good 97.1% |
| Ugandans | 62.2 /100 | #160 | Good 97.1% |
| Immigrants | Belarus | 60.4 /100 | #161 | Good 97.1% |
| Marshallese | 60.2 /100 | #162 | Good 97.1% |
| Albanians | 57.8 /100 | #163 | Average 97.1% |