Immigrants from Northern Africa vs Alsatian 6th Grade
COMPARE
Immigrants from Northern Africa
Alsatian
6th Grade
6th Grade Comparison
Immigrants from Northern Africa
Alsatians
96.9%
6TH GRADE
15.7/ 100
METRIC RATING
199th/ 347
METRIC RANK
97.1%
6TH GRADE
69.8/ 100
METRIC RATING
156th/ 347
METRIC RANK
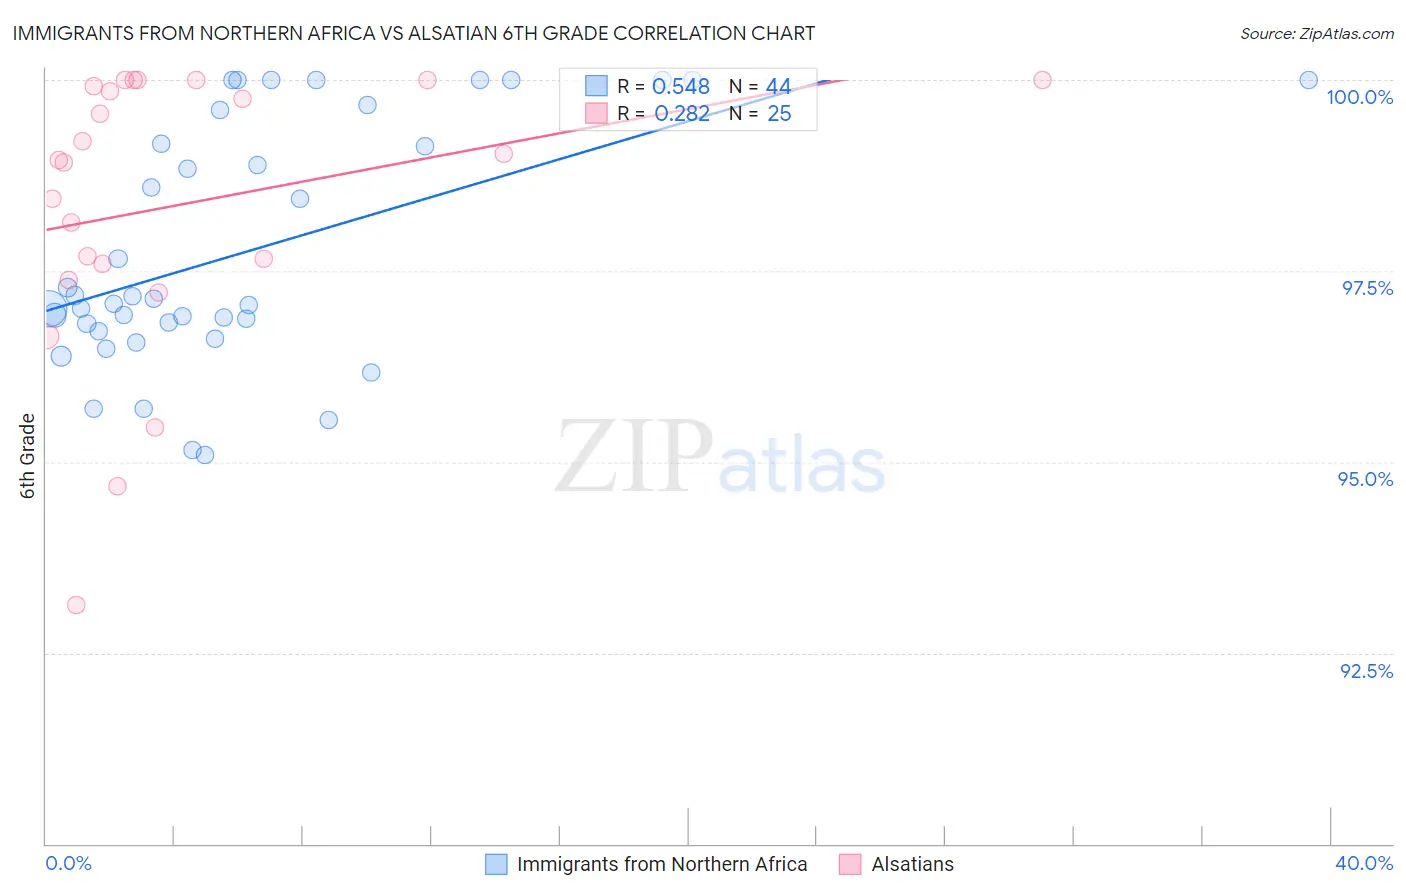
Immigrants from Northern Africa vs Alsatian 6th Grade Correlation Chart
The statistical analysis conducted on geographies consisting of 321,196,768 people shows a substantial positive correlation between the proportion of Immigrants from Northern Africa and percentage of population with at least 6th grade education in the United States with a correlation coefficient (R) of 0.548 and weighted average of 96.9%. Similarly, the statistical analysis conducted on geographies consisting of 82,682,365 people shows a weak positive correlation between the proportion of Alsatians and percentage of population with at least 6th grade education in the United States with a correlation coefficient (R) of 0.282 and weighted average of 97.1%, a difference of 0.29%.
6th Grade Correlation Summary
| Measurement | Immigrants from Northern Africa | Alsatian |
| Minimum | 95.1% | 93.1% |
| Maximum | 100.0% | 100.0% |
| Range | 4.9% | 6.9% |
| Mean | 97.8% | 98.4% |
| Median | 97.1% | 98.9% |
| Interquartile 25% (IQ1) | 96.8% | 97.5% |
| Interquartile 75% (IQ3) | 99.4% | 100.0% |
| Interquartile Range (IQR) | 2.6% | 2.5% |
| Standard Deviation (Sample) | 1.6% | 1.8% |
| Standard Deviation (Population) | 1.6% | 1.8% |
Similar Demographics by 6th Grade
Demographics Similar to Immigrants from Northern Africa by 6th Grade
In terms of 6th grade, the demographic groups most similar to Immigrants from Northern Africa are African (96.9%, a difference of 0.010%), Immigrants from Zaire (96.9%, a difference of 0.010%), Immigrants from Chile (96.8%, a difference of 0.010%), Immigrants from Albania (96.9%, a difference of 0.020%), and Sudanese (96.8%, a difference of 0.020%).
| Demographics | Rating | Rank | 6th Grade |
| Hawaiians | 27.0 /100 | #192 | Fair 96.9% |
| Paraguayans | 26.6 /100 | #193 | Fair 96.9% |
| Immigrants | Lebanon | 25.6 /100 | #194 | Fair 96.9% |
| Immigrants | Brazil | 25.5 /100 | #195 | Fair 96.9% |
| Immigrants | Uganda | 21.2 /100 | #196 | Fair 96.9% |
| Brazilians | 20.1 /100 | #197 | Fair 96.9% |
| Immigrants | Albania | 18.8 /100 | #198 | Poor 96.9% |
| Immigrants | Northern Africa | 15.7 /100 | #199 | Poor 96.9% |
| Africans | 14.8 /100 | #200 | Poor 96.9% |
| Immigrants | Zaire | 14.5 /100 | #201 | Poor 96.9% |
| Immigrants | Chile | 14.2 /100 | #202 | Poor 96.8% |
| Sudanese | 13.9 /100 | #203 | Poor 96.8% |
| Immigrants | Bahamas | 13.8 /100 | #204 | Poor 96.8% |
| Natives/Alaskans | 13.0 /100 | #205 | Poor 96.8% |
| Laotians | 11.8 /100 | #206 | Poor 96.8% |
Demographics Similar to Alsatians by 6th Grade
In terms of 6th grade, the demographic groups most similar to Alsatians are Soviet Union (97.2%, a difference of 0.010%), Ute (97.1%, a difference of 0.010%), Immigrants from Russia (97.1%, a difference of 0.010%), French American Indian (97.2%, a difference of 0.020%), and Immigrants from Jordan (97.2%, a difference of 0.020%).
| Demographics | Rating | Rank | 6th Grade |
| Immigrants | Israel | 76.0 /100 | #149 | Good 97.2% |
| Immigrants | Bosnia and Herzegovina | 74.8 /100 | #150 | Good 97.2% |
| French American Indians | 74.0 /100 | #151 | Good 97.2% |
| Immigrants | Jordan | 73.0 /100 | #152 | Good 97.2% |
| Immigrants | Eastern Europe | 72.6 /100 | #153 | Good 97.2% |
| Soviet Union | 71.5 /100 | #154 | Good 97.2% |
| Ute | 71.1 /100 | #155 | Good 97.1% |
| Alsatians | 69.8 /100 | #156 | Good 97.1% |
| Immigrants | Russia | 67.6 /100 | #157 | Good 97.1% |
| Immigrants | Iran | 63.3 /100 | #158 | Good 97.1% |
| Kenyans | 62.9 /100 | #159 | Good 97.1% |
| Ugandans | 62.2 /100 | #160 | Good 97.1% |
| Immigrants | Belarus | 60.4 /100 | #161 | Good 97.1% |
| Marshallese | 60.2 /100 | #162 | Good 97.1% |
| Albanians | 57.8 /100 | #163 | Average 97.1% |