Alaskan Athabascan vs Alsatian 6th Grade
COMPARE
Alaskan Athabascan
Alsatian
6th Grade
6th Grade Comparison
Alaskan Athabascans
Alsatians
98.1%
6TH GRADE
100.0/ 100
METRIC RATING
12th/ 347
METRIC RANK
97.1%
6TH GRADE
69.8/ 100
METRIC RATING
156th/ 347
METRIC RANK
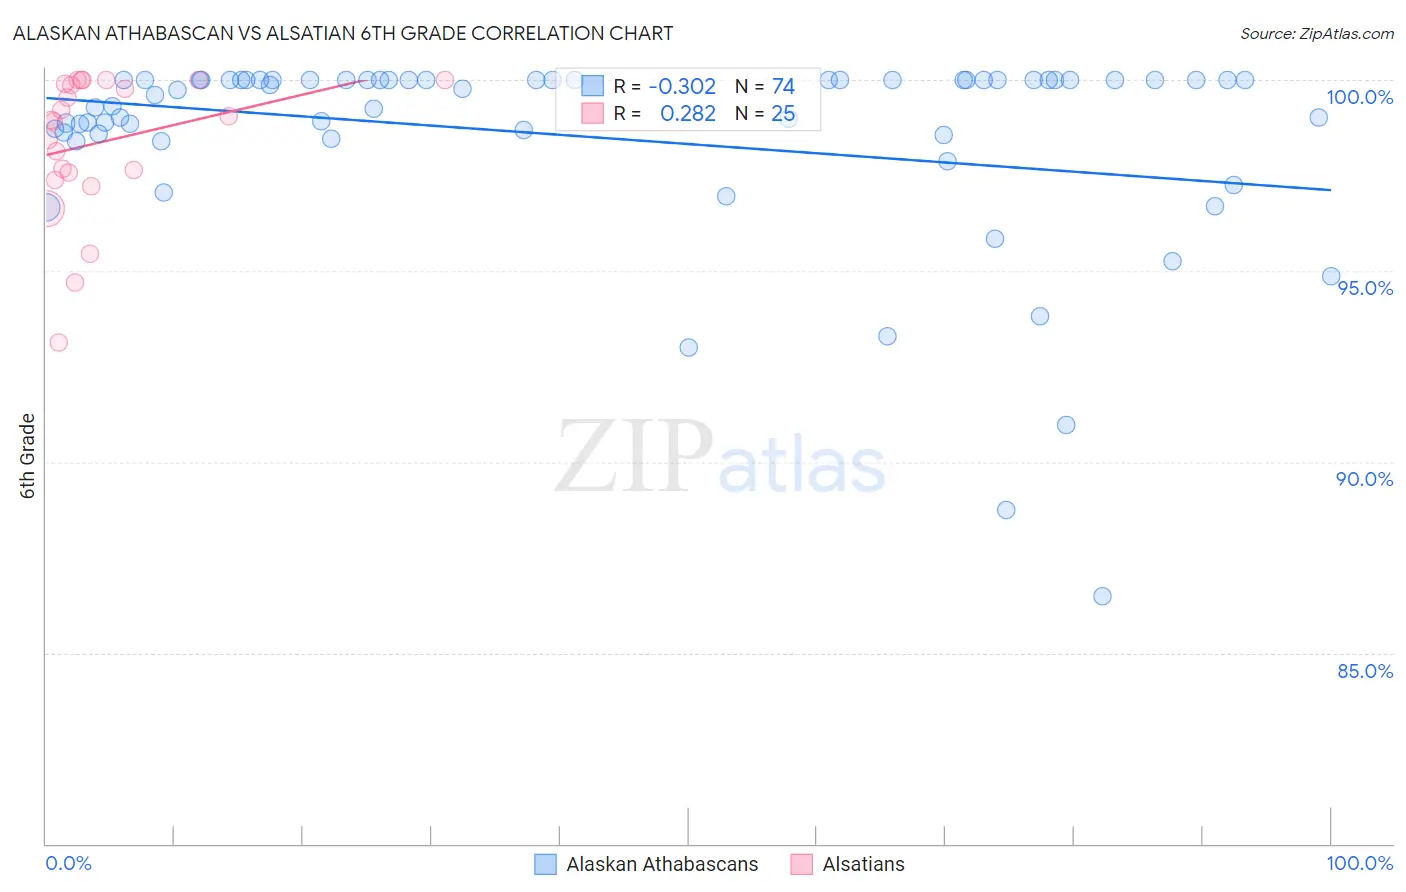
Alaskan Athabascan vs Alsatian 6th Grade Correlation Chart
The statistical analysis conducted on geographies consisting of 45,820,365 people shows a mild negative correlation between the proportion of Alaskan Athabascans and percentage of population with at least 6th grade education in the United States with a correlation coefficient (R) of -0.302 and weighted average of 98.1%. Similarly, the statistical analysis conducted on geographies consisting of 82,682,365 people shows a weak positive correlation between the proportion of Alsatians and percentage of population with at least 6th grade education in the United States with a correlation coefficient (R) of 0.282 and weighted average of 97.1%, a difference of 1.0%.
6th Grade Correlation Summary
| Measurement | Alaskan Athabascan | Alsatian |
| Minimum | 86.5% | 93.1% |
| Maximum | 100.0% | 100.0% |
| Range | 13.5% | 6.9% |
| Mean | 98.5% | 98.4% |
| Median | 99.8% | 98.9% |
| Interquartile 25% (IQ1) | 98.6% | 97.5% |
| Interquartile 75% (IQ3) | 100.0% | 100.0% |
| Interquartile Range (IQR) | 1.4% | 2.5% |
| Standard Deviation (Sample) | 2.6% | 1.8% |
| Standard Deviation (Population) | 2.6% | 1.8% |
Similar Demographics by 6th Grade
Demographics Similar to Alaskan Athabascans by 6th Grade
In terms of 6th grade, the demographic groups most similar to Alaskan Athabascans are English (98.1%, a difference of 0.010%), Tlingit-Haida (98.1%, a difference of 0.010%), Swedish (98.2%, a difference of 0.020%), Carpatho Rusyn (98.1%, a difference of 0.020%), and Inupiat (98.1%, a difference of 0.030%).
| Demographics | Rating | Rank | 6th Grade |
| Tsimshian | 100.0 /100 | #5 | Exceptional 98.3% |
| Norwegians | 100.0 /100 | #6 | Exceptional 98.3% |
| Germans | 100.0 /100 | #7 | Exceptional 98.2% |
| Slovaks | 100.0 /100 | #8 | Exceptional 98.2% |
| Slovenes | 100.0 /100 | #9 | Exceptional 98.2% |
| Swedes | 100.0 /100 | #10 | Exceptional 98.2% |
| English | 100.0 /100 | #11 | Exceptional 98.1% |
| Alaskan Athabascans | 100.0 /100 | #12 | Exceptional 98.1% |
| Tlingit-Haida | 100.0 /100 | #13 | Exceptional 98.1% |
| Carpatho Rusyns | 100.0 /100 | #14 | Exceptional 98.1% |
| Inupiat | 100.0 /100 | #15 | Exceptional 98.1% |
| Scottish | 100.0 /100 | #16 | Exceptional 98.1% |
| Poles | 100.0 /100 | #17 | Exceptional 98.1% |
| Pennsylvania Germans | 100.0 /100 | #18 | Exceptional 98.1% |
| Irish | 100.0 /100 | #19 | Exceptional 98.1% |
Demographics Similar to Alsatians by 6th Grade
In terms of 6th grade, the demographic groups most similar to Alsatians are Soviet Union (97.2%, a difference of 0.010%), Ute (97.1%, a difference of 0.010%), Immigrants from Russia (97.1%, a difference of 0.010%), French American Indian (97.2%, a difference of 0.020%), and Immigrants from Jordan (97.2%, a difference of 0.020%).
| Demographics | Rating | Rank | 6th Grade |
| Immigrants | Israel | 76.0 /100 | #149 | Good 97.2% |
| Immigrants | Bosnia and Herzegovina | 74.8 /100 | #150 | Good 97.2% |
| French American Indians | 74.0 /100 | #151 | Good 97.2% |
| Immigrants | Jordan | 73.0 /100 | #152 | Good 97.2% |
| Immigrants | Eastern Europe | 72.6 /100 | #153 | Good 97.2% |
| Soviet Union | 71.5 /100 | #154 | Good 97.2% |
| Ute | 71.1 /100 | #155 | Good 97.1% |
| Alsatians | 69.8 /100 | #156 | Good 97.1% |
| Immigrants | Russia | 67.6 /100 | #157 | Good 97.1% |
| Immigrants | Iran | 63.3 /100 | #158 | Good 97.1% |
| Kenyans | 62.9 /100 | #159 | Good 97.1% |
| Ugandans | 62.2 /100 | #160 | Good 97.1% |
| Immigrants | Belarus | 60.4 /100 | #161 | Good 97.1% |
| Marshallese | 60.2 /100 | #162 | Good 97.1% |
| Albanians | 57.8 /100 | #163 | Average 97.1% |