Korean vs South American Associate's Degree
COMPARE
Korean
South American
Associate's Degree
Associate's Degree Comparison
Koreans
South Americans
45.8%
ASSOCIATE'S DEGREE
33.8/ 100
METRIC RATING
191st/ 347
METRIC RANK
47.1%
ASSOCIATE'S DEGREE
70.5/ 100
METRIC RATING
156th/ 347
METRIC RANK
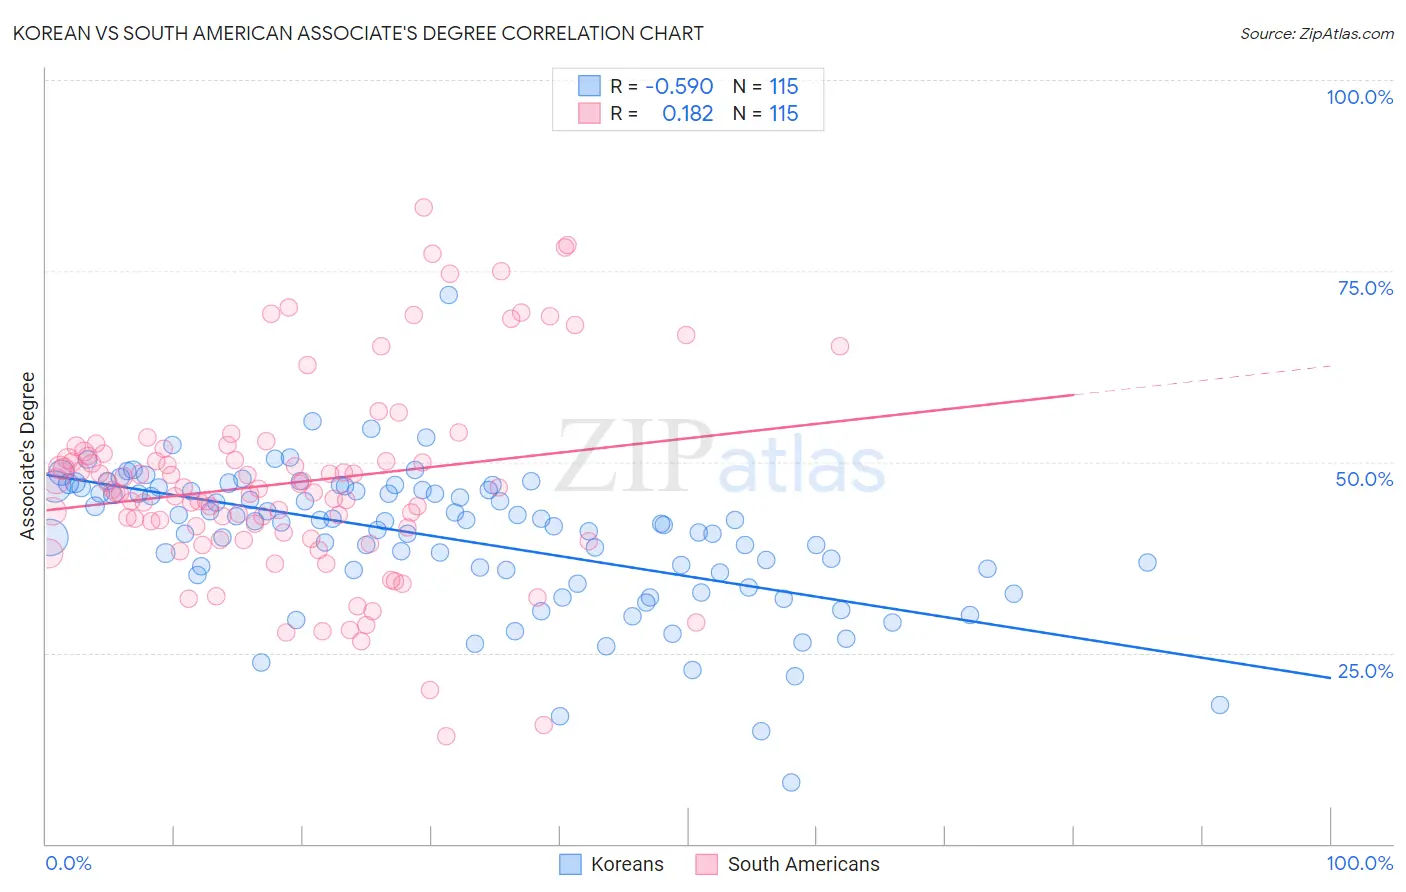
Korean vs South American Associate's Degree Correlation Chart
The statistical analysis conducted on geographies consisting of 510,898,568 people shows a substantial negative correlation between the proportion of Koreans and percentage of population with at least associate's degree education in the United States with a correlation coefficient (R) of -0.590 and weighted average of 45.8%. Similarly, the statistical analysis conducted on geographies consisting of 494,120,152 people shows a poor positive correlation between the proportion of South Americans and percentage of population with at least associate's degree education in the United States with a correlation coefficient (R) of 0.182 and weighted average of 47.1%, a difference of 2.9%.
Associate's Degree Correlation Summary
| Measurement | Korean | South American |
| Minimum | 8.1% | 14.1% |
| Maximum | 71.9% | 83.4% |
| Range | 63.8% | 69.2% |
| Mean | 40.0% | 47.2% |
| Median | 42.1% | 46.3% |
| Interquartile 25% (IQ1) | 35.6% | 40.8% |
| Interquartile 75% (IQ3) | 46.3% | 51.0% |
| Interquartile Range (IQR) | 10.7% | 10.2% |
| Standard Deviation (Sample) | 9.2% | 12.9% |
| Standard Deviation (Population) | 9.2% | 12.8% |
Similar Demographics by Associate's Degree
Demographics Similar to Koreans by Associate's Degree
In terms of associate's degree, the demographic groups most similar to Koreans are Vietnamese (45.8%, a difference of 0.020%), Celtic (45.8%, a difference of 0.050%), Immigrants from Oceania (45.8%, a difference of 0.070%), Ghanaian (45.8%, a difference of 0.13%), and Immigrants from Uruguay (45.8%, a difference of 0.14%).
| Demographics | Rating | Rank | Associate's Degree |
| Czechoslovakians | 40.0 /100 | #184 | Average 46.0% |
| Costa Ricans | 38.6 /100 | #185 | Fair 46.0% |
| Welsh | 37.9 /100 | #186 | Fair 45.9% |
| Immigrants | Uruguay | 35.5 /100 | #187 | Fair 45.8% |
| Ghanaians | 35.5 /100 | #188 | Fair 45.8% |
| Immigrants | Oceania | 34.7 /100 | #189 | Fair 45.8% |
| Vietnamese | 34.0 /100 | #190 | Fair 45.8% |
| Koreans | 33.8 /100 | #191 | Fair 45.8% |
| Celtics | 33.3 /100 | #192 | Fair 45.8% |
| Immigrants | Cameroon | 31.0 /100 | #193 | Fair 45.7% |
| Immigrants | Peru | 27.6 /100 | #194 | Fair 45.5% |
| Germans | 26.5 /100 | #195 | Fair 45.5% |
| French | 25.6 /100 | #196 | Fair 45.4% |
| Scotch-Irish | 22.3 /100 | #197 | Fair 45.3% |
| Immigrants | Bangladesh | 21.3 /100 | #198 | Fair 45.2% |
Demographics Similar to South Americans by Associate's Degree
In terms of associate's degree, the demographic groups most similar to South Americans are Kenyan (47.1%, a difference of 0.010%), Sudanese (47.1%, a difference of 0.020%), Immigrants from Germany (47.1%, a difference of 0.070%), Immigrants from Poland (47.1%, a difference of 0.12%), and Immigrants from Kenya (47.2%, a difference of 0.14%).
| Demographics | Rating | Rank | Associate's Degree |
| Immigrants | Armenia | 76.6 /100 | #149 | Good 47.4% |
| Iraqis | 76.2 /100 | #150 | Good 47.4% |
| Immigrants | North Macedonia | 76.0 /100 | #151 | Good 47.4% |
| Immigrants | Afghanistan | 74.3 /100 | #152 | Good 47.3% |
| Czechs | 72.2 /100 | #153 | Good 47.2% |
| Immigrants | Kenya | 72.1 /100 | #154 | Good 47.2% |
| Kenyans | 70.6 /100 | #155 | Good 47.1% |
| South Americans | 70.5 /100 | #156 | Good 47.1% |
| Sudanese | 70.3 /100 | #157 | Good 47.1% |
| Immigrants | Germany | 69.7 /100 | #158 | Good 47.1% |
| Immigrants | Poland | 69.2 /100 | #159 | Good 47.1% |
| Scottish | 65.4 /100 | #160 | Good 46.9% |
| Scandinavians | 65.2 /100 | #161 | Good 46.9% |
| Immigrants | Africa | 63.2 /100 | #162 | Good 46.8% |
| Somalis | 62.5 /100 | #163 | Good 46.8% |