Puget Sound Salish vs Somali High School Diploma
COMPARE
Puget Sound Salish
Somali
High School Diploma
High School Diploma Comparison
Puget Sound Salish
Somalis
89.9%
HIGH SCHOOL DIPLOMA
89.1/ 100
METRIC RATING
128th/ 347
METRIC RANK
88.6%
HIGH SCHOOL DIPLOMA
17.5/ 100
METRIC RATING
203rd/ 347
METRIC RANK
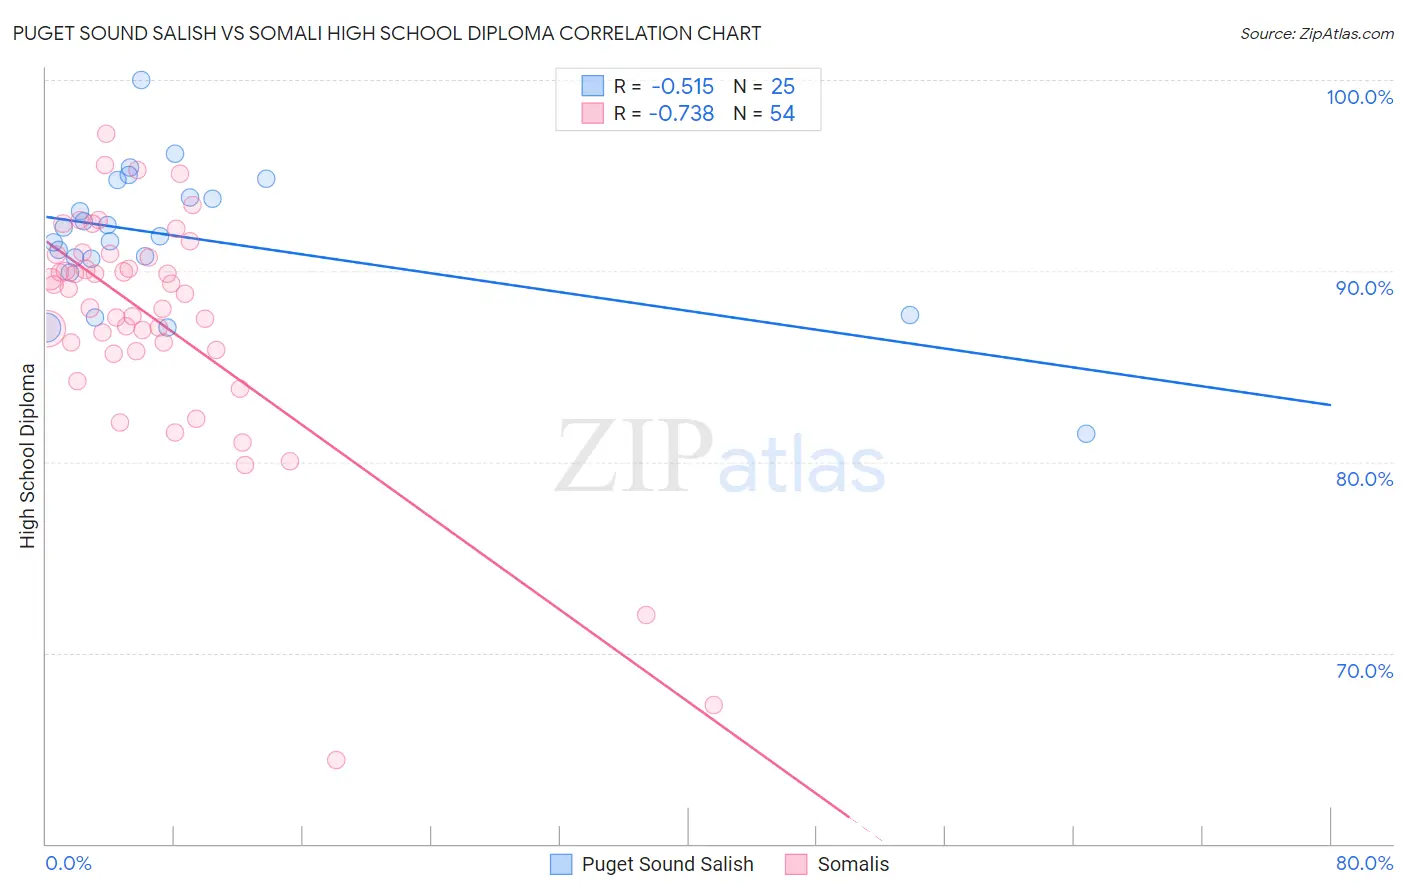
Puget Sound Salish vs Somali High School Diploma Correlation Chart
The statistical analysis conducted on geographies consisting of 46,155,775 people shows a substantial negative correlation between the proportion of Puget Sound Salish and percentage of population with at least high school diploma education in the United States with a correlation coefficient (R) of -0.515 and weighted average of 89.9%. Similarly, the statistical analysis conducted on geographies consisting of 99,332,457 people shows a strong negative correlation between the proportion of Somalis and percentage of population with at least high school diploma education in the United States with a correlation coefficient (R) of -0.738 and weighted average of 88.6%, a difference of 1.4%.
High School Diploma Correlation Summary
| Measurement | Puget Sound Salish | Somali |
| Minimum | 81.5% | 64.4% |
| Maximum | 100.0% | 97.2% |
| Range | 18.5% | 32.8% |
| Mean | 91.7% | 87.4% |
| Median | 91.8% | 88.9% |
| Interquartile 25% (IQ1) | 90.3% | 85.9% |
| Interquartile 75% (IQ3) | 94.3% | 90.9% |
| Interquartile Range (IQR) | 4.0% | 5.0% |
| Standard Deviation (Sample) | 3.7% | 6.2% |
| Standard Deviation (Population) | 3.6% | 6.1% |
Similar Demographics by High School Diploma
Demographics Similar to Puget Sound Salish by High School Diploma
In terms of high school diploma, the demographic groups most similar to Puget Sound Salish are Immigrants from Eastern Asia (89.9%, a difference of 0.0%), Basque (89.8%, a difference of 0.020%), Immigrants from Ukraine (89.8%, a difference of 0.050%), Immigrants from Italy (89.8%, a difference of 0.060%), and Immigrants from Bosnia and Herzegovina (89.8%, a difference of 0.070%).
| Demographics | Rating | Rank | High School Diploma |
| Whites/Caucasians | 94.1 /100 | #121 | Exceptional 90.1% |
| Immigrants | Kazakhstan | 93.4 /100 | #122 | Exceptional 90.0% |
| German Russians | 92.0 /100 | #123 | Exceptional 90.0% |
| Mongolians | 91.6 /100 | #124 | Exceptional 89.9% |
| Egyptians | 91.1 /100 | #125 | Exceptional 89.9% |
| Alaska Natives | 91.0 /100 | #126 | Exceptional 89.9% |
| Immigrants | Eastern Asia | 89.2 /100 | #127 | Excellent 89.9% |
| Puget Sound Salish | 89.1 /100 | #128 | Excellent 89.9% |
| Basques | 88.5 /100 | #129 | Excellent 89.8% |
| Immigrants | Ukraine | 87.9 /100 | #130 | Excellent 89.8% |
| Immigrants | Italy | 87.4 /100 | #131 | Excellent 89.8% |
| Immigrants | Bosnia and Herzegovina | 87.3 /100 | #132 | Excellent 89.8% |
| Albanians | 87.2 /100 | #133 | Excellent 89.8% |
| Immigrants | Jordan | 87.2 /100 | #134 | Excellent 89.8% |
| Chippewa | 85.6 /100 | #135 | Excellent 89.7% |
Demographics Similar to Somalis by High School Diploma
In terms of high school diploma, the demographic groups most similar to Somalis are Panamanian (88.6%, a difference of 0.010%), Armenian (88.6%, a difference of 0.010%), Hawaiian (88.6%, a difference of 0.020%), Korean (88.6%, a difference of 0.020%), and Liberian (88.7%, a difference of 0.030%).
| Demographics | Rating | Rank | High School Diploma |
| Immigrants | Southern Europe | 23.4 /100 | #196 | Fair 88.7% |
| French American Indians | 21.5 /100 | #197 | Fair 88.7% |
| Liberians | 18.8 /100 | #198 | Poor 88.7% |
| Marshallese | 18.7 /100 | #199 | Poor 88.6% |
| Hawaiians | 18.3 /100 | #200 | Poor 88.6% |
| Koreans | 18.1 /100 | #201 | Poor 88.6% |
| Panamanians | 18.0 /100 | #202 | Poor 88.6% |
| Somalis | 17.5 /100 | #203 | Poor 88.6% |
| Armenians | 17.2 /100 | #204 | Poor 88.6% |
| Immigrants | Micronesia | 16.4 /100 | #205 | Poor 88.6% |
| Arapaho | 16.1 /100 | #206 | Poor 88.6% |
| Immigrants | Sierra Leone | 15.8 /100 | #207 | Poor 88.6% |
| Portuguese | 14.4 /100 | #208 | Poor 88.5% |
| Cherokee | 14.3 /100 | #209 | Poor 88.5% |
| Samoans | 14.0 /100 | #210 | Poor 88.5% |