Marshallese vs Indian (Asian) No Schooling Completed
COMPARE
Marshallese
Indian (Asian)
No Schooling Completed
No Schooling Completed Comparison
Marshallese
Indians (Asian)
2.0%
NO SCHOOLING COMPLETED
83.5/ 100
METRIC RATING
140th/ 347
METRIC RANK
2.5%
NO SCHOOLING COMPLETED
0.4/ 100
METRIC RATING
264th/ 347
METRIC RANK
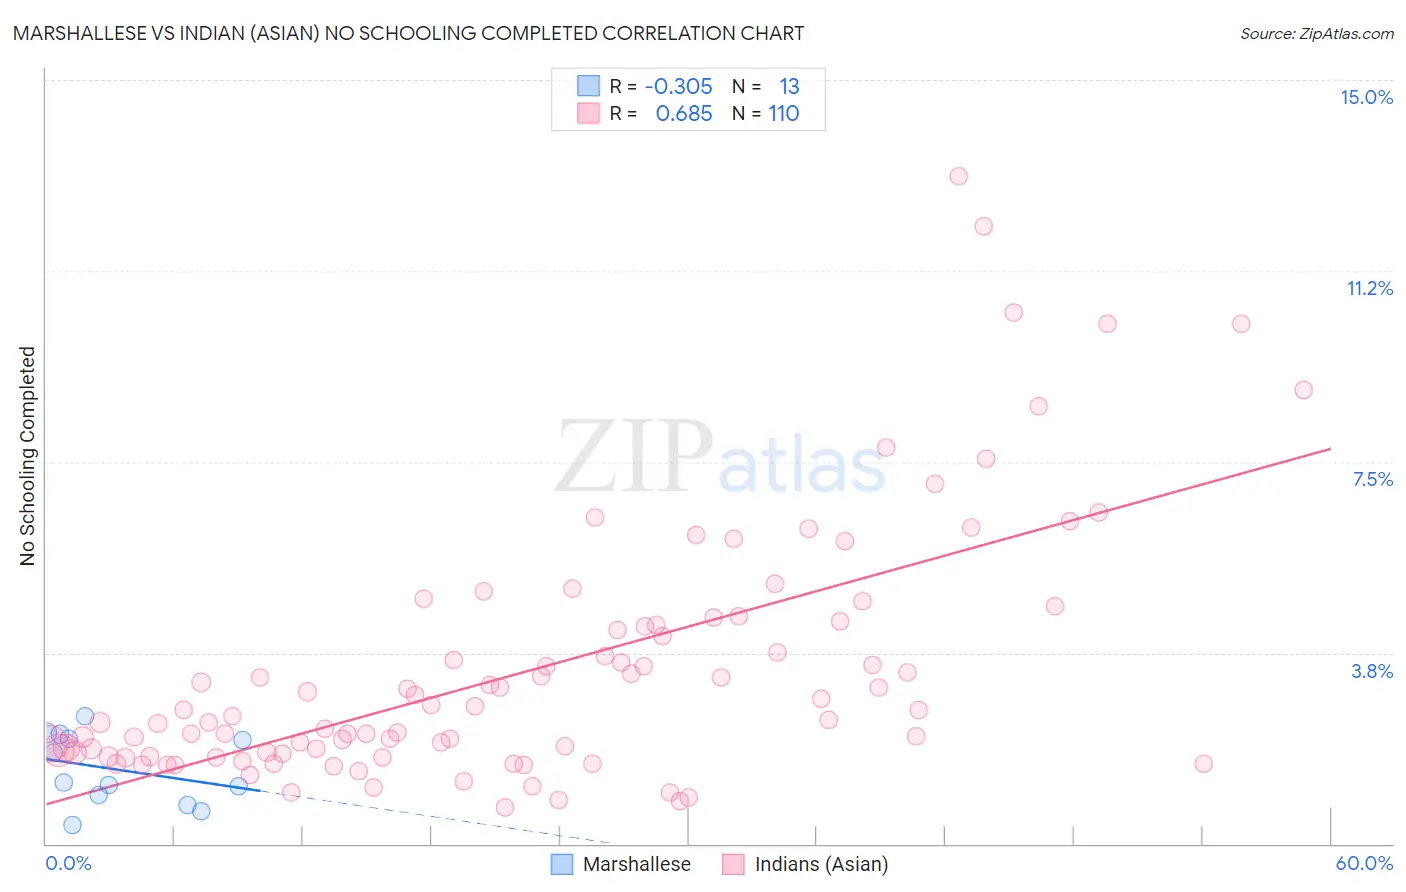
Marshallese vs Indian (Asian) No Schooling Completed Correlation Chart
The statistical analysis conducted on geographies consisting of 14,733,291 people shows a mild negative correlation between the proportion of Marshallese and percentage of population with no schooling in the United States with a correlation coefficient (R) of -0.305 and weighted average of 2.0%. Similarly, the statistical analysis conducted on geographies consisting of 487,020,053 people shows a significant positive correlation between the proportion of Indians (Asian) and percentage of population with no schooling in the United States with a correlation coefficient (R) of 0.685 and weighted average of 2.5%, a difference of 25.2%.
No Schooling Completed Correlation Summary
| Measurement | Marshallese | Indian (Asian) |
| Minimum | 0.36% | 0.70% |
| Maximum | 2.5% | 13.1% |
| Range | 2.1% | 12.4% |
| Mean | 1.5% | 3.4% |
| Median | 1.2% | 2.6% |
| Interquartile 25% (IQ1) | 0.85% | 1.8% |
| Interquartile 75% (IQ3) | 2.1% | 4.3% |
| Interquartile Range (IQR) | 1.2% | 2.5% |
| Standard Deviation (Sample) | 0.70% | 2.5% |
| Standard Deviation (Population) | 0.67% | 2.5% |
Similar Demographics by No Schooling Completed
Demographics Similar to Marshallese by No Schooling Completed
In terms of no schooling completed, the demographic groups most similar to Marshallese are Immigrants from Greece (2.0%, a difference of 0.010%), Jordanian (2.0%, a difference of 0.26%), Venezuelan (2.0%, a difference of 0.50%), Immigrants from Israel (2.0%, a difference of 0.51%), and Filipino (2.0%, a difference of 0.55%).
| Demographics | Rating | Rank | No Schooling Completed |
| Immigrants | Turkey | 90.2 /100 | #133 | Exceptional 1.9% |
| Menominee | 89.6 /100 | #134 | Excellent 1.9% |
| Hmong | 88.5 /100 | #135 | Excellent 1.9% |
| Burmese | 88.2 /100 | #136 | Excellent 1.9% |
| Filipinos | 85.5 /100 | #137 | Excellent 2.0% |
| Immigrants | Israel | 85.4 /100 | #138 | Excellent 2.0% |
| Jordanians | 84.5 /100 | #139 | Excellent 2.0% |
| Marshallese | 83.5 /100 | #140 | Excellent 2.0% |
| Immigrants | Greece | 83.5 /100 | #141 | Excellent 2.0% |
| Venezuelans | 81.5 /100 | #142 | Excellent 2.0% |
| Immigrants | South Central Asia | 80.0 /100 | #143 | Good 2.0% |
| Alsatians | 79.1 /100 | #144 | Good 2.0% |
| Immigrants | Iran | 79.0 /100 | #145 | Good 2.0% |
| Immigrants | Moldova | 78.0 /100 | #146 | Good 2.0% |
| Soviet Union | 77.1 /100 | #147 | Good 2.0% |
Demographics Similar to Indians (Asian) by No Schooling Completed
In terms of no schooling completed, the demographic groups most similar to Indians (Asian) are Immigrants from Liberia (2.5%, a difference of 0.13%), West Indian (2.5%, a difference of 0.18%), Fijian (2.5%, a difference of 0.26%), Immigrants from Sierra Leone (2.5%, a difference of 0.30%), and Yuman (2.5%, a difference of 0.43%).
| Demographics | Rating | Rank | No Schooling Completed |
| Immigrants | South America | 0.6 /100 | #257 | Tragic 2.5% |
| Assyrians/Chaldeans/Syriacs | 0.6 /100 | #258 | Tragic 2.5% |
| Immigrants | Jamaica | 0.6 /100 | #259 | Tragic 2.5% |
| Immigrants | Ethiopia | 0.6 /100 | #260 | Tragic 2.5% |
| Armenians | 0.5 /100 | #261 | Tragic 2.5% |
| Immigrants | Sierra Leone | 0.5 /100 | #262 | Tragic 2.5% |
| Immigrants | Liberia | 0.4 /100 | #263 | Tragic 2.5% |
| Indians (Asian) | 0.4 /100 | #264 | Tragic 2.5% |
| West Indians | 0.4 /100 | #265 | Tragic 2.5% |
| Fijians | 0.4 /100 | #266 | Tragic 2.5% |
| Yuman | 0.4 /100 | #267 | Tragic 2.5% |
| Taiwanese | 0.3 /100 | #268 | Tragic 2.5% |
| Immigrants | Nigeria | 0.2 /100 | #269 | Tragic 2.5% |
| Immigrants | Peru | 0.2 /100 | #270 | Tragic 2.5% |
| Cubans | 0.2 /100 | #271 | Tragic 2.5% |