Tongan vs Guamanian/Chamorro 7th Grade
COMPARE
Tongan
Guamanian/Chamorro
7th Grade
7th Grade Comparison
Tongans
Guamanians/Chamorros
95.4%
7TH GRADE
1.3/ 100
METRIC RATING
247th/ 347
METRIC RANK
95.9%
7TH GRADE
23.5/ 100
METRIC RATING
199th/ 347
METRIC RANK
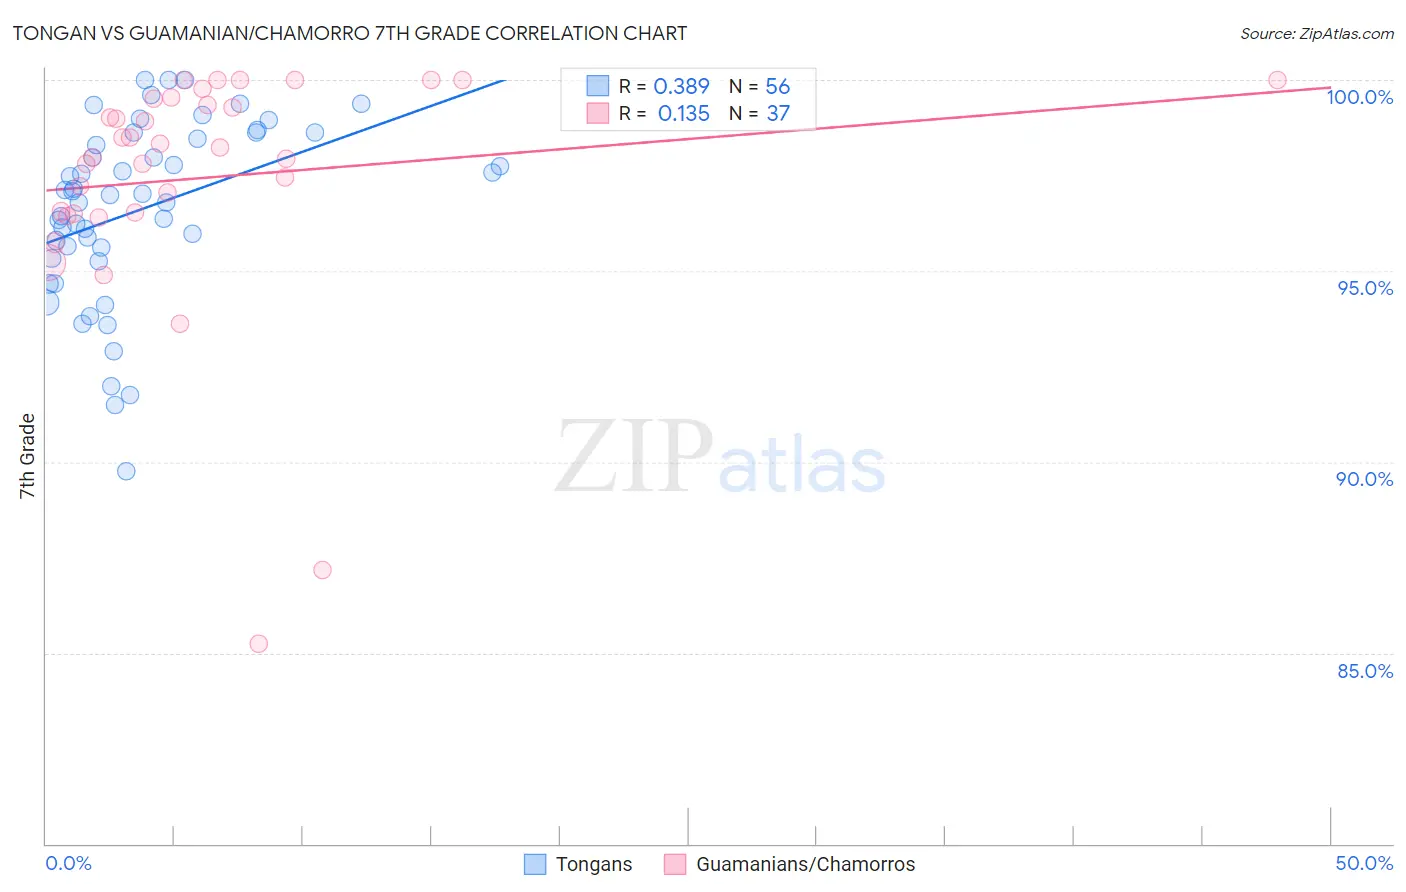
Tongan vs Guamanian/Chamorro 7th Grade Correlation Chart
The statistical analysis conducted on geographies consisting of 102,873,790 people shows a mild positive correlation between the proportion of Tongans and percentage of population with at least 7th grade education in the United States with a correlation coefficient (R) of 0.389 and weighted average of 95.4%. Similarly, the statistical analysis conducted on geographies consisting of 221,965,618 people shows a poor positive correlation between the proportion of Guamanians/Chamorros and percentage of population with at least 7th grade education in the United States with a correlation coefficient (R) of 0.135 and weighted average of 95.9%, a difference of 0.49%.
7th Grade Correlation Summary
| Measurement | Tongan | Guamanian/Chamorro |
| Minimum | 89.7% | 85.2% |
| Maximum | 100.0% | 100.0% |
| Range | 10.3% | 14.8% |
| Mean | 96.6% | 97.4% |
| Median | 97.0% | 98.2% |
| Interquartile 25% (IQ1) | 95.5% | 96.5% |
| Interquartile 75% (IQ3) | 98.5% | 99.5% |
| Interquartile Range (IQR) | 3.1% | 3.0% |
| Standard Deviation (Sample) | 2.3% | 3.2% |
| Standard Deviation (Population) | 2.3% | 3.1% |
Similar Demographics by 7th Grade
Demographics Similar to Tongans by 7th Grade
In terms of 7th grade, the demographic groups most similar to Tongans are Ethiopian (95.4%, a difference of 0.020%), Paiute (95.4%, a difference of 0.020%), Uruguayan (95.4%, a difference of 0.030%), Immigrants from Middle Africa (95.4%, a difference of 0.030%), and Bolivian (95.4%, a difference of 0.030%).
| Demographics | Rating | Rank | 7th Grade |
| Immigrants | Sierra Leone | 2.0 /100 | #240 | Tragic 95.5% |
| South American Indians | 2.0 /100 | #241 | Tragic 95.5% |
| Immigrants | Senegal | 1.9 /100 | #242 | Tragic 95.5% |
| U.S. Virgin Islanders | 1.6 /100 | #243 | Tragic 95.4% |
| Uruguayans | 1.6 /100 | #244 | Tragic 95.4% |
| Immigrants | Middle Africa | 1.5 /100 | #245 | Tragic 95.4% |
| Ethiopians | 1.5 /100 | #246 | Tragic 95.4% |
| Tongans | 1.3 /100 | #247 | Tragic 95.4% |
| Paiute | 1.2 /100 | #248 | Tragic 95.4% |
| Bolivians | 1.1 /100 | #249 | Tragic 95.4% |
| Immigrants | Cameroon | 0.9 /100 | #250 | Tragic 95.4% |
| Immigrants | Jamaica | 0.9 /100 | #251 | Tragic 95.4% |
| Immigrants | Ethiopia | 0.9 /100 | #252 | Tragic 95.3% |
| Somalis | 0.9 /100 | #253 | Tragic 95.3% |
| Colombians | 0.8 /100 | #254 | Tragic 95.3% |
Demographics Similar to Guamanians/Chamorros by 7th Grade
In terms of 7th grade, the demographic groups most similar to Guamanians/Chamorros are Argentinean (95.9%, a difference of 0.0%), Paraguayan (95.9%, a difference of 0.010%), Immigrants from Argentina (95.9%, a difference of 0.010%), Immigrants from Northern Africa (95.8%, a difference of 0.020%), and Comanche (95.8%, a difference of 0.020%).
| Demographics | Rating | Rank | 7th Grade |
| Panamanians | 32.3 /100 | #192 | Fair 95.9% |
| Immigrants | Bahamas | 30.8 /100 | #193 | Fair 95.9% |
| Immigrants | Nepal | 30.0 /100 | #194 | Fair 95.9% |
| Sudanese | 28.1 /100 | #195 | Fair 95.9% |
| Apache | 27.6 /100 | #196 | Fair 95.9% |
| Immigrants | Zaire | 26.7 /100 | #197 | Fair 95.9% |
| Paraguayans | 24.8 /100 | #198 | Fair 95.9% |
| Guamanians/Chamorros | 23.5 /100 | #199 | Fair 95.9% |
| Argentineans | 23.2 /100 | #200 | Fair 95.9% |
| Immigrants | Argentina | 21.9 /100 | #201 | Fair 95.9% |
| Immigrants | Northern Africa | 21.4 /100 | #202 | Fair 95.8% |
| Comanche | 21.1 /100 | #203 | Fair 95.8% |
| Assyrians/Chaldeans/Syriacs | 20.5 /100 | #204 | Fair 95.8% |
| Moroccans | 18.9 /100 | #205 | Poor 95.8% |
| Africans | 17.6 /100 | #206 | Poor 95.8% |