Tongan vs Immigrants from Cuba 6th Grade
COMPARE
Tongan
Immigrants from Cuba
6th Grade
6th Grade Comparison
Tongans
Immigrants from Cuba
96.7%
6TH GRADE
6.1/ 100
METRIC RATING
221st/ 347
METRIC RANK
95.6%
6TH GRADE
0.0/ 100
METRIC RATING
305th/ 347
METRIC RANK
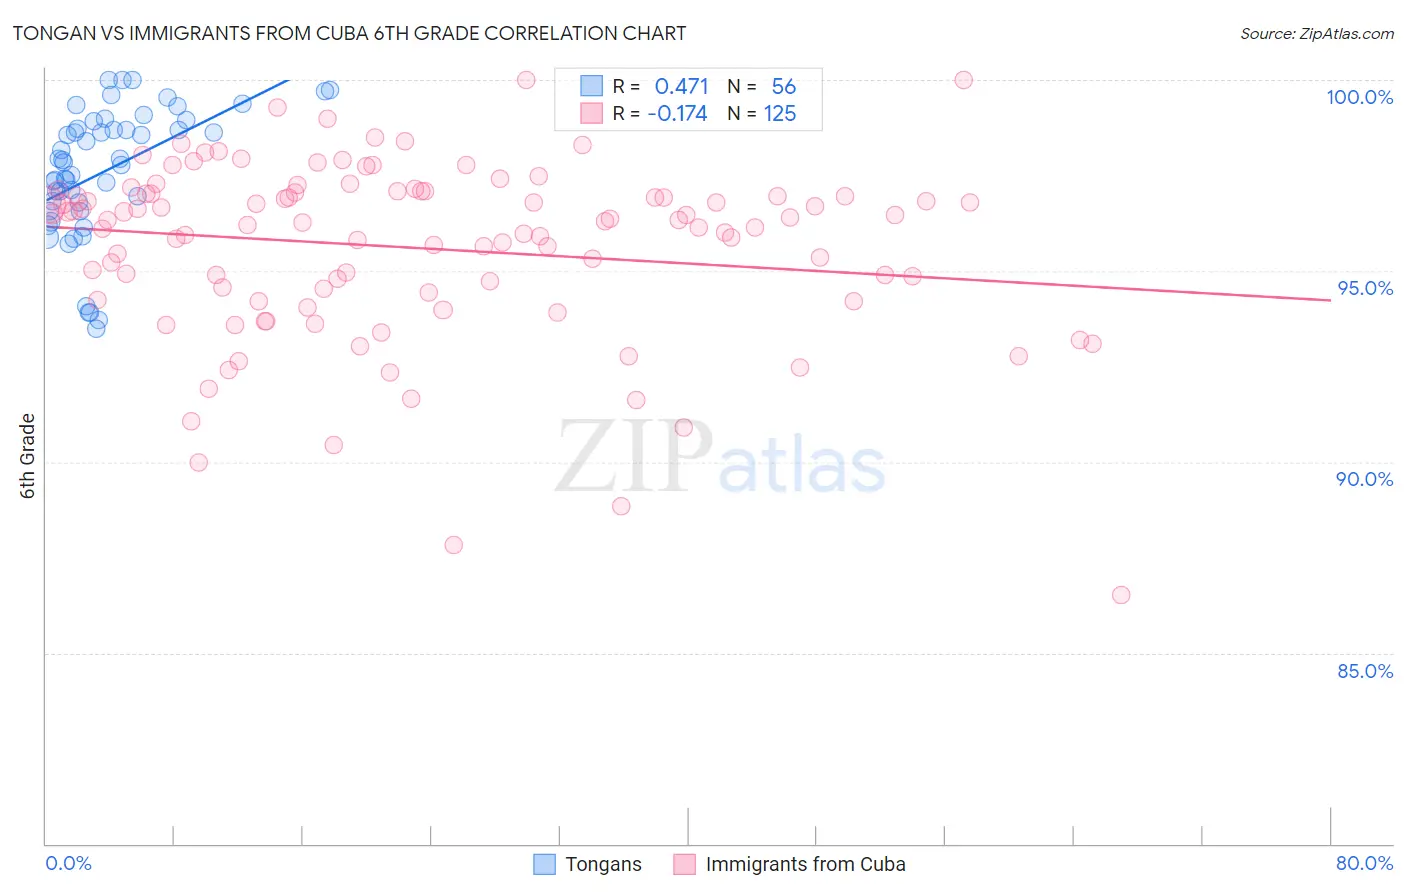
Tongan vs Immigrants from Cuba 6th Grade Correlation Chart
The statistical analysis conducted on geographies consisting of 102,873,790 people shows a moderate positive correlation between the proportion of Tongans and percentage of population with at least 6th grade education in the United States with a correlation coefficient (R) of 0.471 and weighted average of 96.7%. Similarly, the statistical analysis conducted on geographies consisting of 326,028,159 people shows a poor negative correlation between the proportion of Immigrants from Cuba and percentage of population with at least 6th grade education in the United States with a correlation coefficient (R) of -0.174 and weighted average of 95.6%, a difference of 1.2%.
6th Grade Correlation Summary
| Measurement | Tongan | Immigrants from Cuba |
| Minimum | 93.5% | 86.5% |
| Maximum | 100.0% | 100.0% |
| Range | 6.5% | 13.5% |
| Mean | 97.6% | 95.6% |
| Median | 97.9% | 96.3% |
| Interquartile 25% (IQ1) | 96.7% | 94.3% |
| Interquartile 75% (IQ3) | 98.8% | 97.0% |
| Interquartile Range (IQR) | 2.1% | 2.7% |
| Standard Deviation (Sample) | 1.7% | 2.3% |
| Standard Deviation (Population) | 1.7% | 2.3% |
Similar Demographics by 6th Grade
Demographics Similar to Tongans by 6th Grade
In terms of 6th grade, the demographic groups most similar to Tongans are Immigrants from Morocco (96.7%, a difference of 0.0%), Immigrants from Syria (96.7%, a difference of 0.0%), Costa Rican (96.8%, a difference of 0.010%), Liberian (96.8%, a difference of 0.020%), and Navajo (96.8%, a difference of 0.020%).
| Demographics | Rating | Rank | 6th Grade |
| Portuguese | 8.2 /100 | #214 | Tragic 96.8% |
| Sierra Leoneans | 8.0 /100 | #215 | Tragic 96.8% |
| Paiute | 7.8 /100 | #216 | Tragic 96.8% |
| Liberians | 7.5 /100 | #217 | Tragic 96.8% |
| Navajo | 7.3 /100 | #218 | Tragic 96.8% |
| Costa Ricans | 6.8 /100 | #219 | Tragic 96.8% |
| Immigrants | Morocco | 6.2 /100 | #220 | Tragic 96.7% |
| Tongans | 6.1 /100 | #221 | Tragic 96.7% |
| Immigrants | Syria | 5.9 /100 | #222 | Tragic 96.7% |
| Bahamians | 4.8 /100 | #223 | Tragic 96.7% |
| Immigrants | Southern Europe | 4.4 /100 | #224 | Tragic 96.7% |
| Immigrants | Pakistan | 4.4 /100 | #225 | Tragic 96.7% |
| Immigrants | Panama | 4.2 /100 | #226 | Tragic 96.7% |
| Immigrants | Western Asia | 4.1 /100 | #227 | Tragic 96.7% |
| Immigrants | Malaysia | 4.0 /100 | #228 | Tragic 96.7% |
Demographics Similar to Immigrants from Cuba by 6th Grade
In terms of 6th grade, the demographic groups most similar to Immigrants from Cuba are Indonesian (95.6%, a difference of 0.020%), Bangladeshi (95.7%, a difference of 0.030%), Immigrants from Haiti (95.6%, a difference of 0.040%), Guyanese (95.6%, a difference of 0.060%), and Immigrants from Caribbean (95.6%, a difference of 0.070%).
| Demographics | Rating | Rank | 6th Grade |
| Sri Lankans | 0.0 /100 | #298 | Tragic 95.8% |
| Immigrants | Laos | 0.0 /100 | #299 | Tragic 95.7% |
| Immigrants | Dominica | 0.0 /100 | #300 | Tragic 95.7% |
| Immigrants | Immigrants | 0.0 /100 | #301 | Tragic 95.7% |
| Immigrants | Burma/Myanmar | 0.0 /100 | #302 | Tragic 95.7% |
| Bangladeshis | 0.0 /100 | #303 | Tragic 95.7% |
| Indonesians | 0.0 /100 | #304 | Tragic 95.6% |
| Immigrants | Cuba | 0.0 /100 | #305 | Tragic 95.6% |
| Immigrants | Haiti | 0.0 /100 | #306 | Tragic 95.6% |
| Guyanese | 0.0 /100 | #307 | Tragic 95.6% |
| Immigrants | Caribbean | 0.0 /100 | #308 | Tragic 95.6% |
| Puerto Ricans | 0.0 /100 | #309 | Tragic 95.5% |
| Ecuadorians | 0.0 /100 | #310 | Tragic 95.5% |
| Immigrants | Portugal | 0.0 /100 | #311 | Tragic 95.5% |
| Immigrants | Guyana | 0.0 /100 | #312 | Tragic 95.5% |