Tohono O'odham vs Immigrants from Europe 11th Grade
COMPARE
Tohono O'odham
Immigrants from Europe
11th Grade
11th Grade Comparison
Tohono O'odham
Immigrants from Europe
87.6%
11TH GRADE
0.0/ 100
METRIC RATING
328th/ 347
METRIC RANK
93.5%
11TH GRADE
98.6/ 100
METRIC RATING
104th/ 347
METRIC RANK
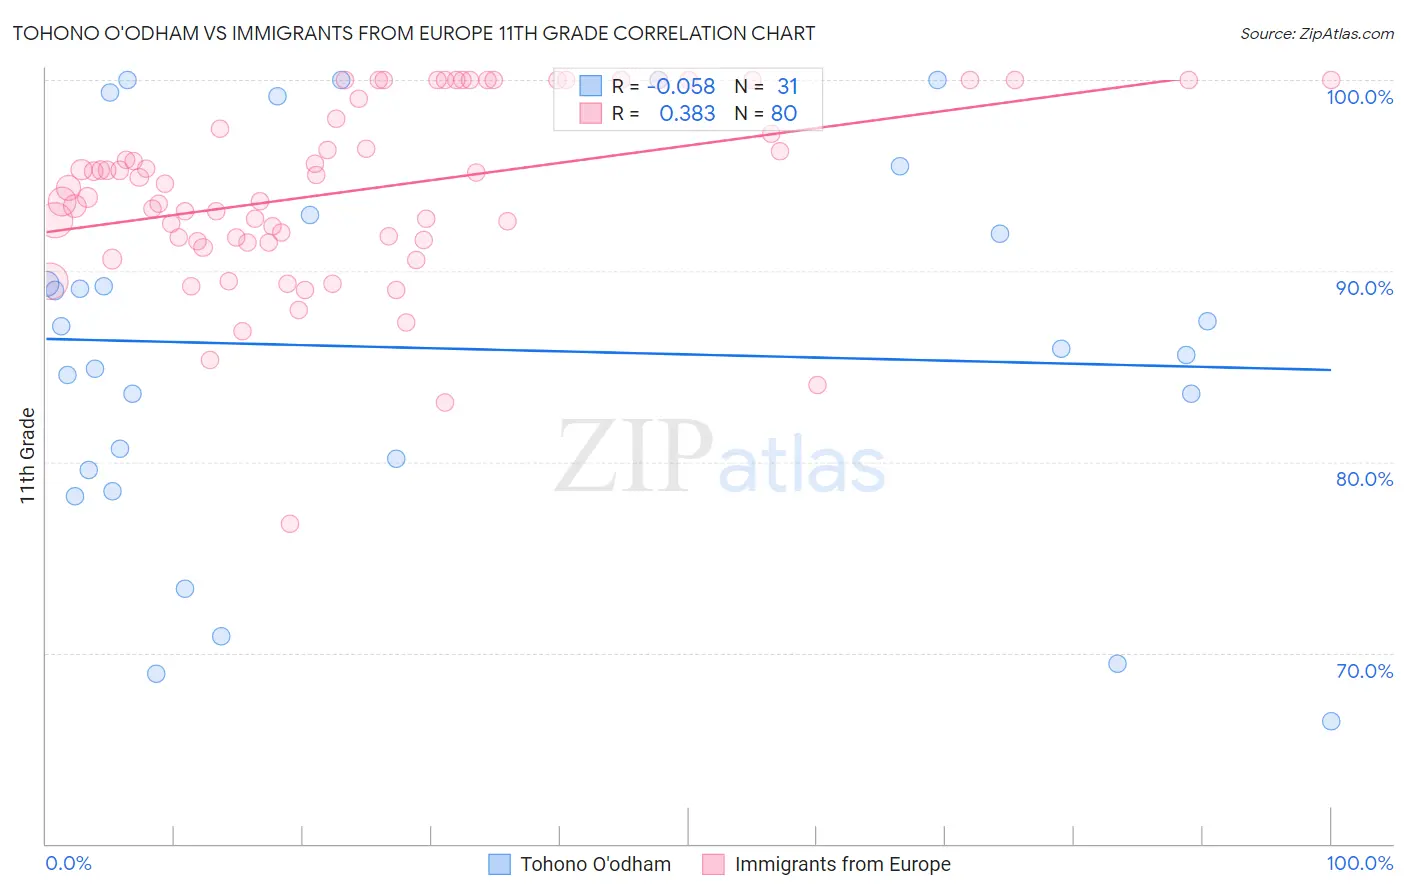
Tohono O'odham vs Immigrants from Europe 11th Grade Correlation Chart
The statistical analysis conducted on geographies consisting of 58,730,615 people shows a slight negative correlation between the proportion of Tohono O'odham and percentage of population with at least 11th grade education in the United States with a correlation coefficient (R) of -0.058 and weighted average of 87.6%. Similarly, the statistical analysis conducted on geographies consisting of 547,425,973 people shows a mild positive correlation between the proportion of Immigrants from Europe and percentage of population with at least 11th grade education in the United States with a correlation coefficient (R) of 0.383 and weighted average of 93.5%, a difference of 6.7%.
11th Grade Correlation Summary
| Measurement | Tohono O'odham | Immigrants from Europe |
| Minimum | 66.4% | 76.7% |
| Maximum | 100.0% | 100.0% |
| Range | 33.6% | 23.3% |
| Mean | 85.9% | 94.2% |
| Median | 86.0% | 94.5% |
| Interquartile 25% (IQ1) | 79.6% | 91.6% |
| Interquartile 75% (IQ3) | 93.0% | 99.5% |
| Interquartile Range (IQR) | 13.4% | 7.9% |
| Standard Deviation (Sample) | 9.9% | 4.8% |
| Standard Deviation (Population) | 9.7% | 4.7% |
Similar Demographics by 11th Grade
Demographics Similar to Tohono O'odham by 11th Grade
In terms of 11th grade, the demographic groups most similar to Tohono O'odham are Immigrants from Cabo Verde (87.6%, a difference of 0.060%), Mexican American Indian (87.5%, a difference of 0.070%), Dominican (87.7%, a difference of 0.080%), Honduran (87.4%, a difference of 0.26%), and Hispanic or Latino (87.3%, a difference of 0.32%).
| Demographics | Rating | Rank | 11th Grade |
| Immigrants | Belize | 0.0 /100 | #321 | Tragic 88.7% |
| Puerto Ricans | 0.0 /100 | #322 | Tragic 88.4% |
| Pima | 0.0 /100 | #323 | Tragic 88.3% |
| Central American Indians | 0.0 /100 | #324 | Tragic 88.2% |
| Immigrants | Nicaragua | 0.0 /100 | #325 | Tragic 88.1% |
| Dominicans | 0.0 /100 | #326 | Tragic 87.7% |
| Immigrants | Cabo Verde | 0.0 /100 | #327 | Tragic 87.6% |
| Tohono O'odham | 0.0 /100 | #328 | Tragic 87.6% |
| Mexican American Indians | 0.0 /100 | #329 | Tragic 87.5% |
| Hondurans | 0.0 /100 | #330 | Tragic 87.4% |
| Hispanics or Latinos | 0.0 /100 | #331 | Tragic 87.3% |
| Immigrants | Azores | 0.0 /100 | #332 | Tragic 87.2% |
| Immigrants | Yemen | 0.0 /100 | #333 | Tragic 87.1% |
| Houma | 0.0 /100 | #334 | Tragic 87.0% |
| Central Americans | 0.0 /100 | #335 | Tragic 86.9% |
Demographics Similar to Immigrants from Europe by 11th Grade
In terms of 11th grade, the demographic groups most similar to Immigrants from Europe are Chippewa (93.5%, a difference of 0.0%), Lebanese (93.5%, a difference of 0.0%), Immigrants from Serbia (93.5%, a difference of 0.0%), Immigrants from Croatia (93.5%, a difference of 0.0%), and Immigrants from Romania (93.5%, a difference of 0.010%).
| Demographics | Rating | Rank | 11th Grade |
| Immigrants | Iran | 98.9 /100 | #97 | Exceptional 93.5% |
| Immigrants | Israel | 98.8 /100 | #98 | Exceptional 93.5% |
| Menominee | 98.7 /100 | #99 | Exceptional 93.5% |
| Immigrants | North Macedonia | 98.7 /100 | #100 | Exceptional 93.5% |
| Immigrants | Romania | 98.7 /100 | #101 | Exceptional 93.5% |
| Chippewa | 98.6 /100 | #102 | Exceptional 93.5% |
| Lebanese | 98.6 /100 | #103 | Exceptional 93.5% |
| Immigrants | Europe | 98.6 /100 | #104 | Exceptional 93.5% |
| Immigrants | Serbia | 98.6 /100 | #105 | Exceptional 93.5% |
| Immigrants | Croatia | 98.6 /100 | #106 | Exceptional 93.5% |
| Immigrants | Norway | 98.4 /100 | #107 | Exceptional 93.5% |
| Alaska Natives | 98.4 /100 | #108 | Exceptional 93.5% |
| Immigrants | Kuwait | 98.4 /100 | #109 | Exceptional 93.5% |
| Syrians | 98.4 /100 | #110 | Exceptional 93.4% |
| Yugoslavians | 98.1 /100 | #111 | Exceptional 93.4% |