Immigrants from Panama vs Immigrants from Albania 4th Grade
COMPARE
Immigrants from Panama
Immigrants from Albania
4th Grade
4th Grade Comparison
Immigrants from Panama
Immigrants from Albania
97.3%
4TH GRADE
5.4/ 100
METRIC RATING
221st/ 347
METRIC RANK
97.4%
4TH GRADE
27.7/ 100
METRIC RATING
196th/ 347
METRIC RANK
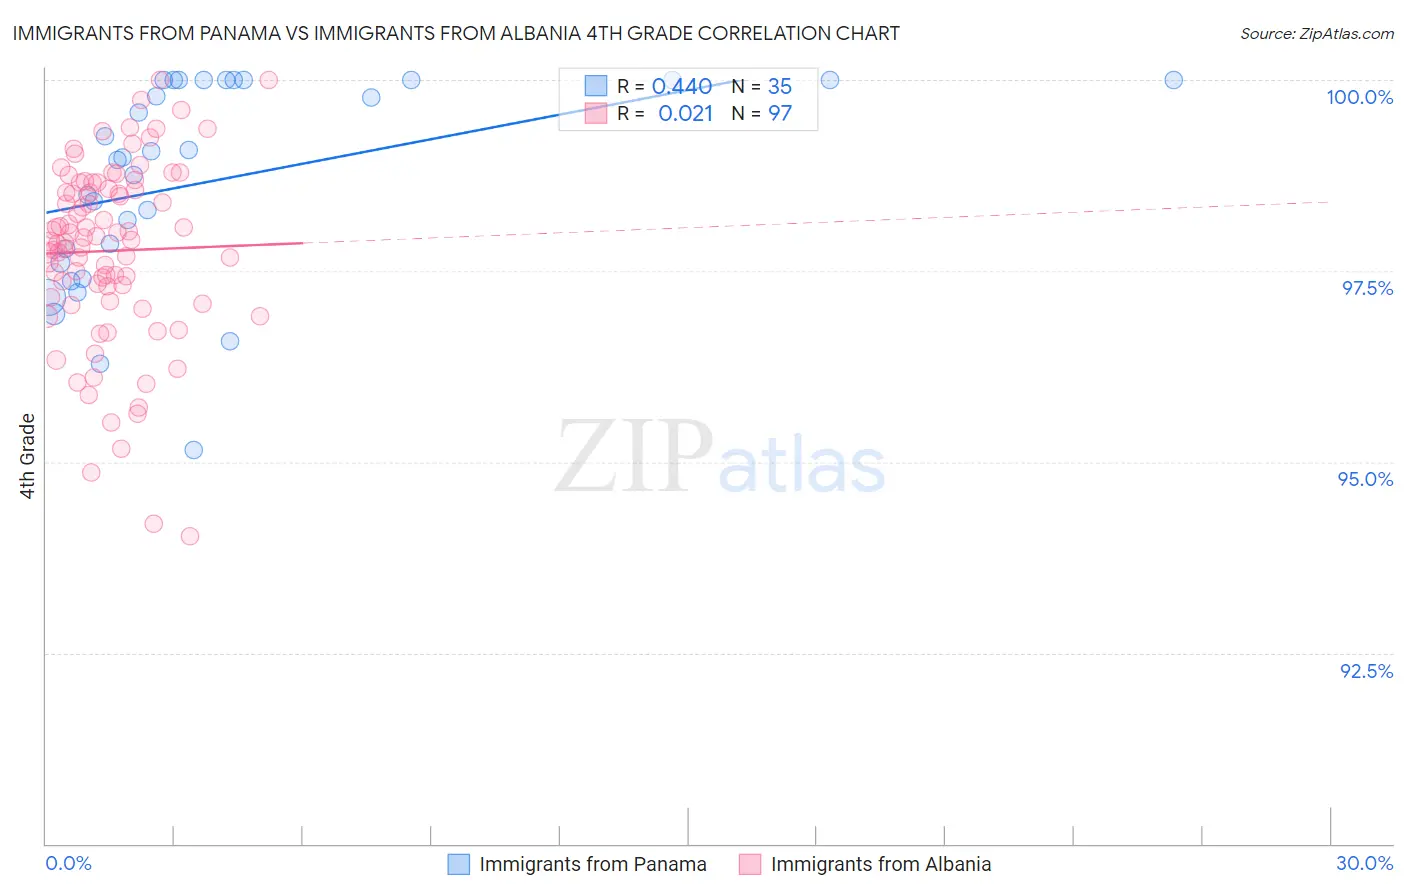
Immigrants from Panama vs Immigrants from Albania 4th Grade Correlation Chart
The statistical analysis conducted on geographies consisting of 221,182,871 people shows a moderate positive correlation between the proportion of Immigrants from Panama and percentage of population with at least 4th grade education in the United States with a correlation coefficient (R) of 0.440 and weighted average of 97.3%. Similarly, the statistical analysis conducted on geographies consisting of 119,265,453 people shows no correlation between the proportion of Immigrants from Albania and percentage of population with at least 4th grade education in the United States with a correlation coefficient (R) of 0.021 and weighted average of 97.4%, a difference of 0.18%.
4th Grade Correlation Summary
| Measurement | Immigrants from Panama | Immigrants from Albania |
| Minimum | 95.1% | 94.0% |
| Maximum | 100.0% | 100.0% |
| Range | 4.9% | 6.0% |
| Mean | 98.7% | 97.8% |
| Median | 99.0% | 97.9% |
| Interquartile 25% (IQ1) | 97.6% | 97.1% |
| Interquartile 75% (IQ3) | 100.0% | 98.6% |
| Interquartile Range (IQR) | 2.4% | 1.5% |
| Standard Deviation (Sample) | 1.3% | 1.2% |
| Standard Deviation (Population) | 1.3% | 1.2% |
Similar Demographics by 4th Grade
Demographics Similar to Immigrants from Panama by 4th Grade
In terms of 4th grade, the demographic groups most similar to Immigrants from Panama are South American Indian (97.3%, a difference of 0.0%), Tongan (97.3%, a difference of 0.010%), Immigrants from Lebanon (97.3%, a difference of 0.010%), Immigrants from Sudan (97.2%, a difference of 0.010%), and Immigrants from Syria (97.2%, a difference of 0.010%).
| Demographics | Rating | Rank | 4th Grade |
| Immigrants | Nepal | 7.7 /100 | #214 | Tragic 97.3% |
| Immigrants | Morocco | 7.1 /100 | #215 | Tragic 97.3% |
| Samoans | 6.8 /100 | #216 | Tragic 97.3% |
| Sierra Leoneans | 6.5 /100 | #217 | Tragic 97.3% |
| Iraqis | 6.3 /100 | #218 | Tragic 97.3% |
| Tongans | 5.8 /100 | #219 | Tragic 97.3% |
| South American Indians | 5.5 /100 | #220 | Tragic 97.3% |
| Immigrants | Panama | 5.4 /100 | #221 | Tragic 97.3% |
| Immigrants | Lebanon | 5.1 /100 | #222 | Tragic 97.3% |
| Immigrants | Sudan | 5.0 /100 | #223 | Tragic 97.2% |
| Immigrants | Syria | 5.0 /100 | #224 | Tragic 97.2% |
| Immigrants | Iraq | 4.6 /100 | #225 | Tragic 97.2% |
| Bahamians | 3.8 /100 | #226 | Tragic 97.2% |
| Immigrants | Pakistan | 3.7 /100 | #227 | Tragic 97.2% |
| Sub-Saharan Africans | 3.6 /100 | #228 | Tragic 97.2% |
Demographics Similar to Immigrants from Albania by 4th Grade
In terms of 4th grade, the demographic groups most similar to Immigrants from Albania are Navajo (97.4%, a difference of 0.010%), Immigrants from Ukraine (97.4%, a difference of 0.010%), Immigrants from Egypt (97.4%, a difference of 0.010%), Portuguese (97.4%, a difference of 0.010%), and Paraguayan (97.4%, a difference of 0.010%).
| Demographics | Rating | Rank | 4th Grade |
| Panamanians | 31.9 /100 | #189 | Fair 97.4% |
| Blacks/African Americans | 31.1 /100 | #190 | Fair 97.4% |
| Navajo | 30.7 /100 | #191 | Fair 97.4% |
| Immigrants | Ukraine | 30.1 /100 | #192 | Fair 97.4% |
| Immigrants | Egypt | 30.1 /100 | #193 | Fair 97.4% |
| Portuguese | 29.2 /100 | #194 | Fair 97.4% |
| Paraguayans | 28.9 /100 | #195 | Fair 97.4% |
| Immigrants | Albania | 27.7 /100 | #196 | Fair 97.4% |
| Hawaiians | 25.6 /100 | #197 | Fair 97.4% |
| Guamanians/Chamorros | 23.0 /100 | #198 | Fair 97.4% |
| Natives/Alaskans | 20.6 /100 | #199 | Fair 97.4% |
| Immigrants | Uganda | 19.8 /100 | #200 | Poor 97.4% |
| Immigrants | Southern Europe | 16.2 /100 | #201 | Poor 97.4% |
| Immigrants | Chile | 16.1 /100 | #202 | Poor 97.4% |
| Immigrants | Northern Africa | 15.1 /100 | #203 | Poor 97.4% |