Tlingit-Haida vs Mexican American Indian 10th Grade
COMPARE
Tlingit-Haida
Mexican American Indian
10th Grade
10th Grade Comparison
Tlingit-Haida
Mexican American Indians
95.7%
10TH GRADE
100.0/ 100
METRIC RATING
12th/ 347
METRIC RANK
89.0%
10TH GRADE
0.0/ 100
METRIC RATING
331st/ 347
METRIC RANK
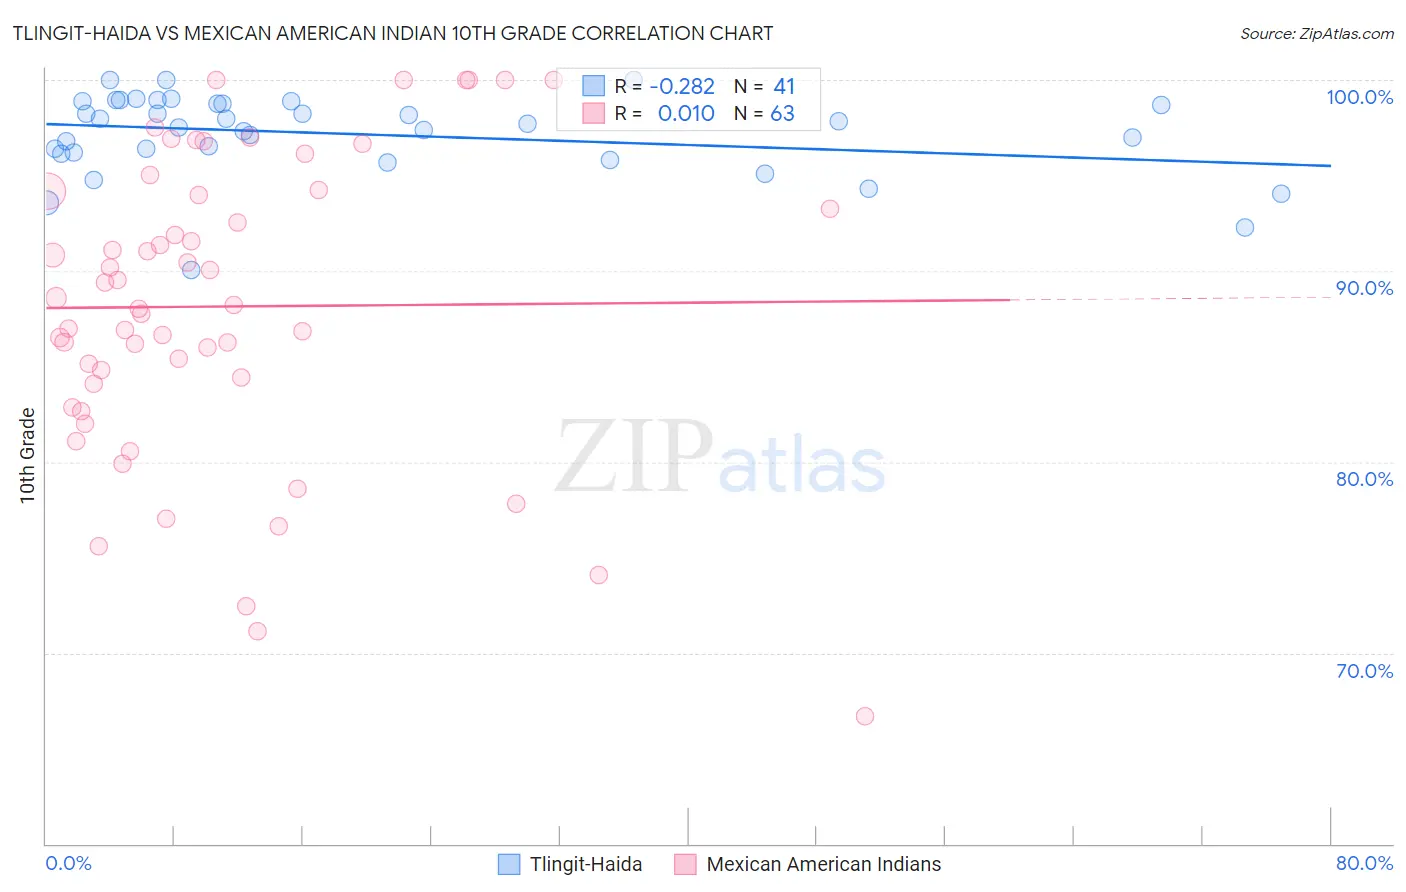
Tlingit-Haida vs Mexican American Indian 10th Grade Correlation Chart
The statistical analysis conducted on geographies consisting of 60,871,919 people shows a weak negative correlation between the proportion of Tlingit-Haida and percentage of population with at least 10th grade education in the United States with a correlation coefficient (R) of -0.282 and weighted average of 95.7%. Similarly, the statistical analysis conducted on geographies consisting of 317,621,155 people shows no correlation between the proportion of Mexican American Indians and percentage of population with at least 10th grade education in the United States with a correlation coefficient (R) of 0.010 and weighted average of 89.0%, a difference of 7.4%.
10th Grade Correlation Summary
| Measurement | Tlingit-Haida | Mexican American Indian |
| Minimum | 90.1% | 66.7% |
| Maximum | 100.0% | 100.0% |
| Range | 9.9% | 33.3% |
| Mean | 97.2% | 88.1% |
| Median | 97.7% | 88.2% |
| Interquartile 25% (IQ1) | 96.2% | 84.1% |
| Interquartile 75% (IQ3) | 98.8% | 94.2% |
| Interquartile Range (IQR) | 2.7% | 10.1% |
| Standard Deviation (Sample) | 2.1% | 7.8% |
| Standard Deviation (Population) | 2.1% | 7.8% |
Similar Demographics by 10th Grade
Demographics Similar to Tlingit-Haida by 10th Grade
In terms of 10th grade, the demographic groups most similar to Tlingit-Haida are Danish (95.7%, a difference of 0.040%), English (95.6%, a difference of 0.040%), Tsimshian (95.6%, a difference of 0.040%), Irish (95.6%, a difference of 0.060%), and Croatian (95.7%, a difference of 0.080%).
| Demographics | Rating | Rank | 10th Grade |
| Carpatho Rusyns | 100.0 /100 | #5 | Exceptional 95.9% |
| Poles | 100.0 /100 | #6 | Exceptional 95.8% |
| Germans | 100.0 /100 | #7 | Exceptional 95.8% |
| Lithuanians | 100.0 /100 | #8 | Exceptional 95.8% |
| Finns | 100.0 /100 | #9 | Exceptional 95.8% |
| Croatians | 100.0 /100 | #10 | Exceptional 95.7% |
| Danes | 100.0 /100 | #11 | Exceptional 95.7% |
| Tlingit-Haida | 100.0 /100 | #12 | Exceptional 95.7% |
| English | 100.0 /100 | #13 | Exceptional 95.6% |
| Tsimshian | 100.0 /100 | #14 | Exceptional 95.6% |
| Irish | 100.0 /100 | #15 | Exceptional 95.6% |
| Scottish | 100.0 /100 | #16 | Exceptional 95.6% |
| Latvians | 100.0 /100 | #17 | Exceptional 95.6% |
| Italians | 100.0 /100 | #18 | Exceptional 95.6% |
| Scandinavians | 100.0 /100 | #19 | Exceptional 95.6% |
Demographics Similar to Mexican American Indians by 10th Grade
In terms of 10th grade, the demographic groups most similar to Mexican American Indians are Immigrants from Yemen (89.1%, a difference of 0.030%), Immigrants from the Azores (89.0%, a difference of 0.040%), Honduran (89.0%, a difference of 0.070%), Hispanic or Latino (88.9%, a difference of 0.19%), and Immigrants from Dominican Republic (88.7%, a difference of 0.37%).
| Demographics | Rating | Rank | 10th Grade |
| Immigrants | Armenia | 0.0 /100 | #324 | Tragic 89.9% |
| Puerto Ricans | 0.0 /100 | #325 | Tragic 89.8% |
| Central American Indians | 0.0 /100 | #326 | Tragic 89.7% |
| Immigrants | Nicaragua | 0.0 /100 | #327 | Tragic 89.5% |
| Immigrants | Cabo Verde | 0.0 /100 | #328 | Tragic 89.5% |
| Dominicans | 0.0 /100 | #329 | Tragic 89.4% |
| Immigrants | Yemen | 0.0 /100 | #330 | Tragic 89.1% |
| Mexican American Indians | 0.0 /100 | #331 | Tragic 89.0% |
| Immigrants | Azores | 0.0 /100 | #332 | Tragic 89.0% |
| Hondurans | 0.0 /100 | #333 | Tragic 89.0% |
| Hispanics or Latinos | 0.0 /100 | #334 | Tragic 88.9% |
| Immigrants | Dominican Republic | 0.0 /100 | #335 | Tragic 88.7% |
| Immigrants | Honduras | 0.0 /100 | #336 | Tragic 88.5% |
| Central Americans | 0.0 /100 | #337 | Tragic 88.4% |
| Immigrants | Latin America | 0.0 /100 | #338 | Tragic 88.3% |