Tlingit-Haida vs Irish 2nd Grade
COMPARE
Tlingit-Haida
Irish
2nd Grade
2nd Grade Comparison
Tlingit-Haida
Irish
98.6%
2ND GRADE
100.0/ 100
METRIC RATING
11th/ 347
METRIC RANK
98.6%
2ND GRADE
100.0/ 100
METRIC RATING
18th/ 347
METRIC RANK
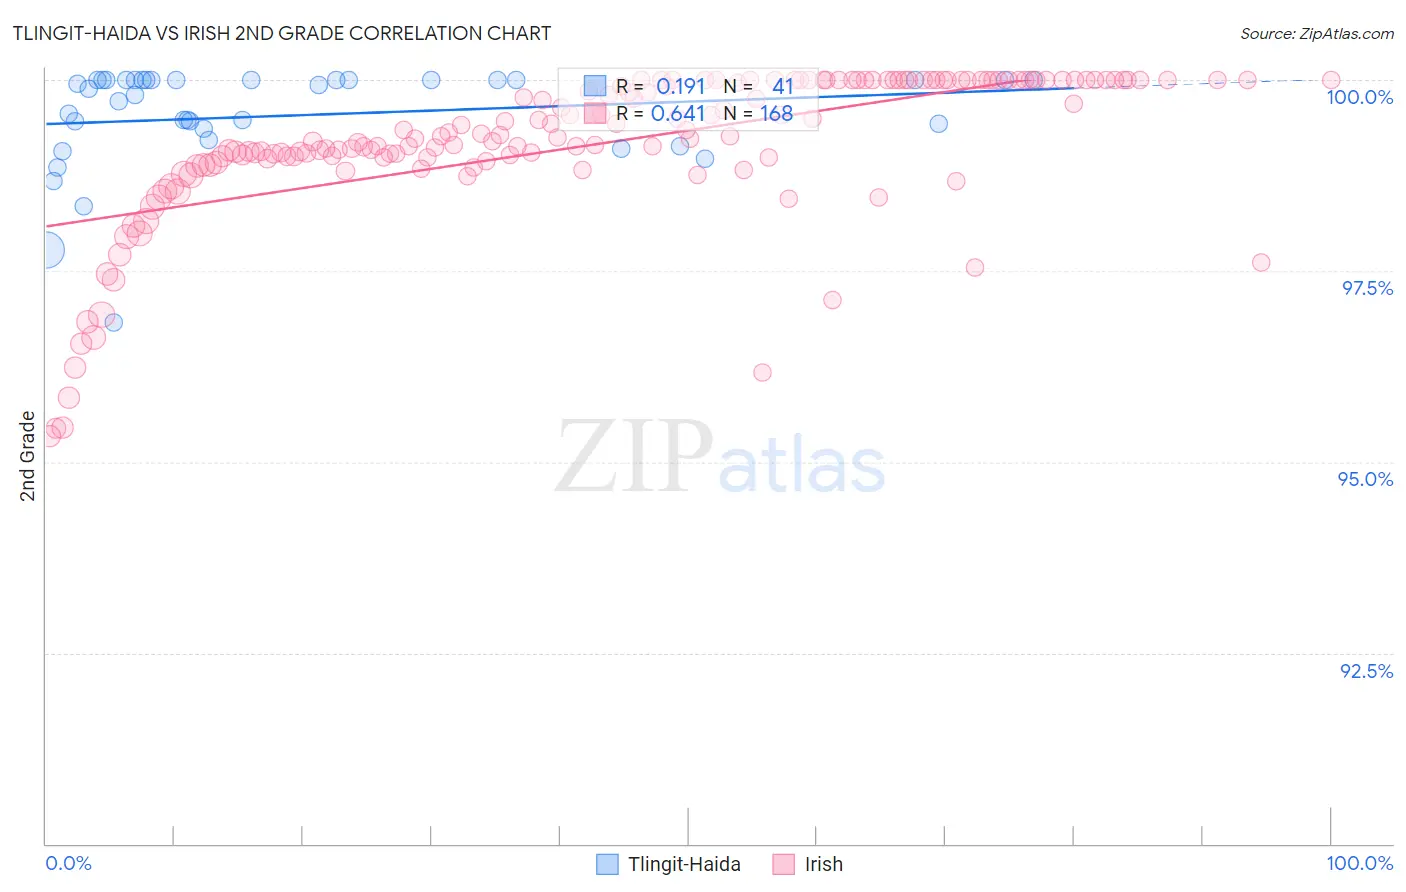
Tlingit-Haida vs Irish 2nd Grade Correlation Chart
The statistical analysis conducted on geographies consisting of 60,865,648 people shows a poor positive correlation between the proportion of Tlingit-Haida and percentage of population with at least 2nd grade education in the United States with a correlation coefficient (R) of 0.191 and weighted average of 98.6%. Similarly, the statistical analysis conducted on geographies consisting of 580,708,963 people shows a significant positive correlation between the proportion of Irish and percentage of population with at least 2nd grade education in the United States with a correlation coefficient (R) of 0.641 and weighted average of 98.6%, a difference of 0.070%.
2nd Grade Correlation Summary
| Measurement | Tlingit-Haida | Irish |
| Minimum | 96.8% | 95.3% |
| Maximum | 100.0% | 100.0% |
| Range | 3.2% | 4.7% |
| Mean | 99.5% | 99.2% |
| Median | 99.9% | 99.3% |
| Interquartile 25% (IQ1) | 99.3% | 98.9% |
| Interquartile 75% (IQ3) | 100.0% | 100.0% |
| Interquartile Range (IQR) | 0.71% | 1.1% |
| Standard Deviation (Sample) | 0.68% | 1.00% |
| Standard Deviation (Population) | 0.67% | 0.99% |
Demographics Similar to Tlingit-Haida and Irish by 2nd Grade
In terms of 2nd grade, the demographic groups most similar to Tlingit-Haida are Slovene (98.6%, a difference of 0.0%), Carpatho Rusyn (98.6%, a difference of 0.010%), English (98.6%, a difference of 0.010%), Swedish (98.6%, a difference of 0.020%), and German (98.7%, a difference of 0.030%). Similarly, the demographic groups most similar to Irish are Aleut (98.6%, a difference of 0.0%), Finnish (98.5%, a difference of 0.010%), Sioux (98.5%, a difference of 0.010%), Lithuanian (98.5%, a difference of 0.010%), and Polish (98.5%, a difference of 0.010%).
| Demographics | Rating | Rank | 2nd Grade |
| Tsimshian | 100.0 /100 | #4 | Exceptional 98.8% |
| Alaskan Athabascans | 100.0 /100 | #5 | Exceptional 98.7% |
| Alaska Natives | 100.0 /100 | #6 | Exceptional 98.7% |
| Norwegians | 100.0 /100 | #7 | Exceptional 98.7% |
| Germans | 100.0 /100 | #8 | Exceptional 98.7% |
| Slovaks | 100.0 /100 | #9 | Exceptional 98.7% |
| Slovenes | 100.0 /100 | #10 | Exceptional 98.6% |
| Tlingit-Haida | 100.0 /100 | #11 | Exceptional 98.6% |
| Carpatho Rusyns | 100.0 /100 | #12 | Exceptional 98.6% |
| English | 100.0 /100 | #13 | Exceptional 98.6% |
| Swedes | 100.0 /100 | #14 | Exceptional 98.6% |
| Scottish | 100.0 /100 | #15 | Exceptional 98.6% |
| Dutch | 100.0 /100 | #16 | Exceptional 98.6% |
| Aleuts | 100.0 /100 | #17 | Exceptional 98.6% |
| Irish | 100.0 /100 | #18 | Exceptional 98.6% |
| Finns | 100.0 /100 | #19 | Exceptional 98.5% |
| Sioux | 100.0 /100 | #20 | Exceptional 98.5% |
| Lithuanians | 100.0 /100 | #21 | Exceptional 98.5% |
| Poles | 100.0 /100 | #22 | Exceptional 98.5% |
| Danes | 100.0 /100 | #23 | Exceptional 98.5% |
| Pennsylvania Germans | 100.0 /100 | #24 | Exceptional 98.5% |