Thai vs Vietnamese 6th Grade
COMPARE
Thai
Vietnamese
6th Grade
6th Grade Comparison
Thais
Vietnamese
97.4%
6TH GRADE
96.9/ 100
METRIC RATING
110th/ 347
METRIC RANK
95.3%
6TH GRADE
0.0/ 100
METRIC RATING
317th/ 347
METRIC RANK
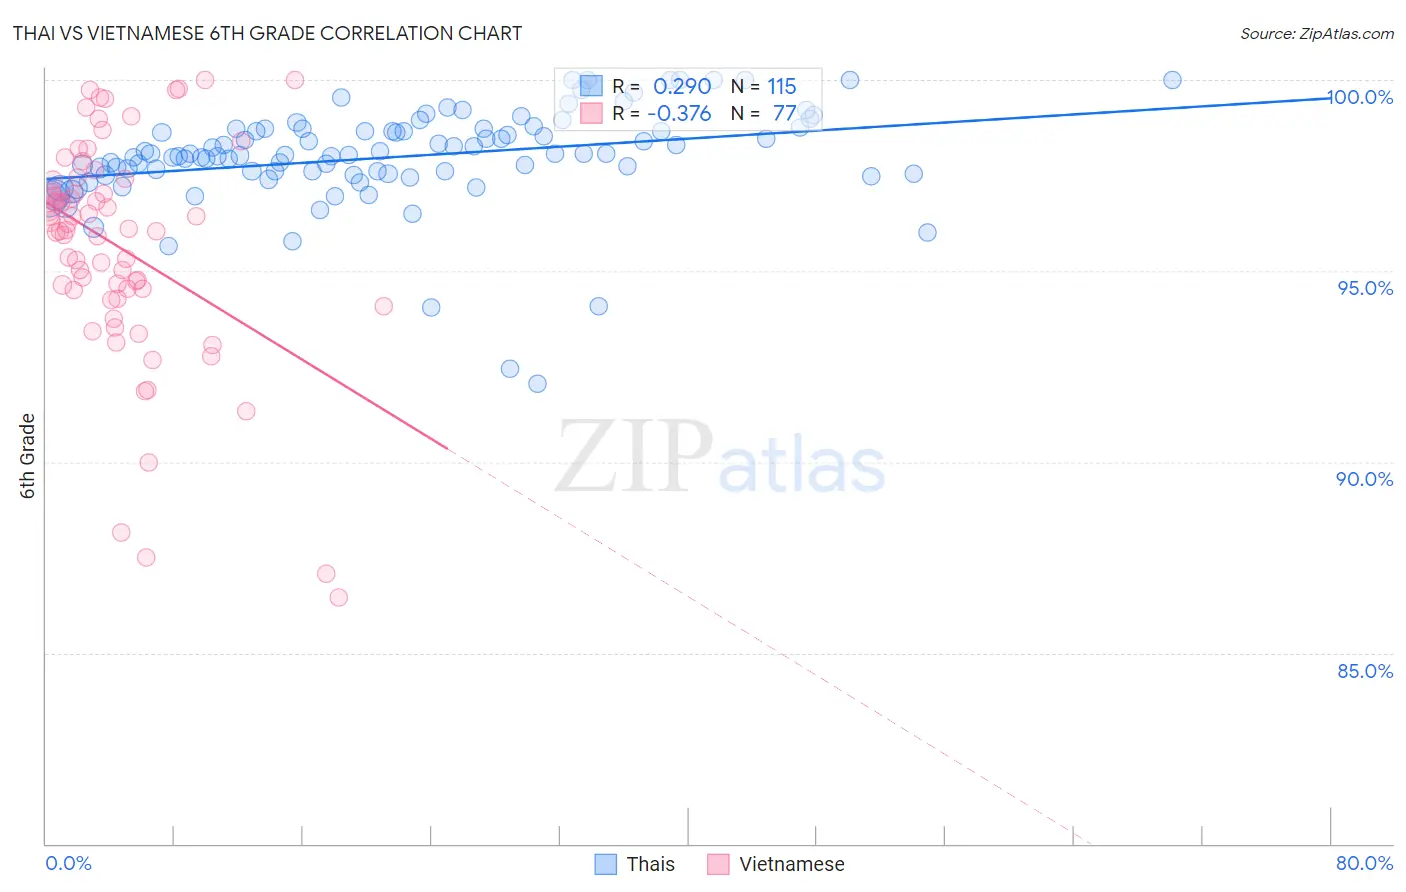
Thai vs Vietnamese 6th Grade Correlation Chart
The statistical analysis conducted on geographies consisting of 475,866,115 people shows a weak positive correlation between the proportion of Thais and percentage of population with at least 6th grade education in the United States with a correlation coefficient (R) of 0.290 and weighted average of 97.4%. Similarly, the statistical analysis conducted on geographies consisting of 170,728,240 people shows a mild negative correlation between the proportion of Vietnamese and percentage of population with at least 6th grade education in the United States with a correlation coefficient (R) of -0.376 and weighted average of 95.3%, a difference of 2.2%.
6th Grade Correlation Summary
| Measurement | Thai | Vietnamese |
| Minimum | 92.1% | 86.5% |
| Maximum | 100.0% | 100.0% |
| Range | 7.9% | 13.5% |
| Mean | 98.0% | 95.6% |
| Median | 98.0% | 96.1% |
| Interquartile 25% (IQ1) | 97.5% | 94.4% |
| Interquartile 75% (IQ3) | 98.7% | 97.4% |
| Interquartile Range (IQR) | 1.2% | 3.0% |
| Standard Deviation (Sample) | 1.3% | 2.9% |
| Standard Deviation (Population) | 1.3% | 2.9% |
Similar Demographics by 6th Grade
Demographics Similar to Thais by 6th Grade
In terms of 6th grade, the demographic groups most similar to Thais are Iroquois (97.4%, a difference of 0.0%), Immigrants from Latvia (97.4%, a difference of 0.010%), Nonimmigrants (97.4%, a difference of 0.020%), Immigrants from Czechoslovakia (97.4%, a difference of 0.020%), and Immigrants from Saudi Arabia (97.4%, a difference of 0.020%).
| Demographics | Rating | Rank | 6th Grade |
| Bhutanese | 98.0 /100 | #103 | Exceptional 97.5% |
| German Russians | 97.9 /100 | #104 | Exceptional 97.5% |
| Cheyenne | 97.9 /100 | #105 | Exceptional 97.5% |
| Menominee | 97.7 /100 | #106 | Exceptional 97.5% |
| Immigrants | Singapore | 97.6 /100 | #107 | Exceptional 97.5% |
| Immigrants | Nonimmigrants | 97.3 /100 | #108 | Exceptional 97.4% |
| Immigrants | Czechoslovakia | 97.3 /100 | #109 | Exceptional 97.4% |
| Thais | 96.9 /100 | #110 | Exceptional 97.4% |
| Iroquois | 96.9 /100 | #111 | Exceptional 97.4% |
| Immigrants | Latvia | 96.7 /100 | #112 | Exceptional 97.4% |
| Immigrants | Saudi Arabia | 96.5 /100 | #113 | Exceptional 97.4% |
| Colville | 96.4 /100 | #114 | Exceptional 97.4% |
| Immigrants | Switzerland | 95.7 /100 | #115 | Exceptional 97.4% |
| Lebanese | 95.5 /100 | #116 | Exceptional 97.4% |
| Basques | 95.4 /100 | #117 | Exceptional 97.4% |
Demographics Similar to Vietnamese by 6th Grade
In terms of 6th grade, the demographic groups most similar to Vietnamese are Belizean (95.3%, a difference of 0.020%), Japanese (95.4%, a difference of 0.030%), Immigrants from Belize (95.3%, a difference of 0.030%), Immigrants from Bangladesh (95.4%, a difference of 0.040%), and Immigrants from Vietnam (95.4%, a difference of 0.050%).
| Demographics | Rating | Rank | 6th Grade |
| Ecuadorians | 0.0 /100 | #310 | Tragic 95.5% |
| Immigrants | Portugal | 0.0 /100 | #311 | Tragic 95.5% |
| Immigrants | Guyana | 0.0 /100 | #312 | Tragic 95.5% |
| Nicaraguans | 0.0 /100 | #313 | Tragic 95.4% |
| Immigrants | Vietnam | 0.0 /100 | #314 | Tragic 95.4% |
| Immigrants | Bangladesh | 0.0 /100 | #315 | Tragic 95.4% |
| Japanese | 0.0 /100 | #316 | Tragic 95.4% |
| Vietnamese | 0.0 /100 | #317 | Tragic 95.3% |
| Belizeans | 0.0 /100 | #318 | Tragic 95.3% |
| Immigrants | Belize | 0.0 /100 | #319 | Tragic 95.3% |
| Immigrants | Ecuador | 0.0 /100 | #320 | Tragic 95.3% |
| Immigrants | Fiji | 0.0 /100 | #321 | Tragic 95.2% |
| Immigrants | Cambodia | 0.0 /100 | #322 | Tragic 95.2% |
| Central American Indians | 0.0 /100 | #323 | Tragic 95.1% |
| Cape Verdeans | 0.0 /100 | #324 | Tragic 95.1% |